Unlock a world of possibilities! Login now and discover the exclusive benefits awaiting you.
- Qlik Community
- :
- All Forums
- :
- QlikView App Dev
- :
- Re: Problem with Line Chart?
- Subscribe to RSS Feed
- Mark Topic as New
- Mark Topic as Read
- Float this Topic for Current User
- Bookmark
- Subscribe
- Mute
- Printer Friendly Page
- Mark as New
- Bookmark
- Subscribe
- Mute
- Subscribe to RSS Feed
- Permalink
- Report Inappropriate Content
Problem with Line Chart?
Hi All,
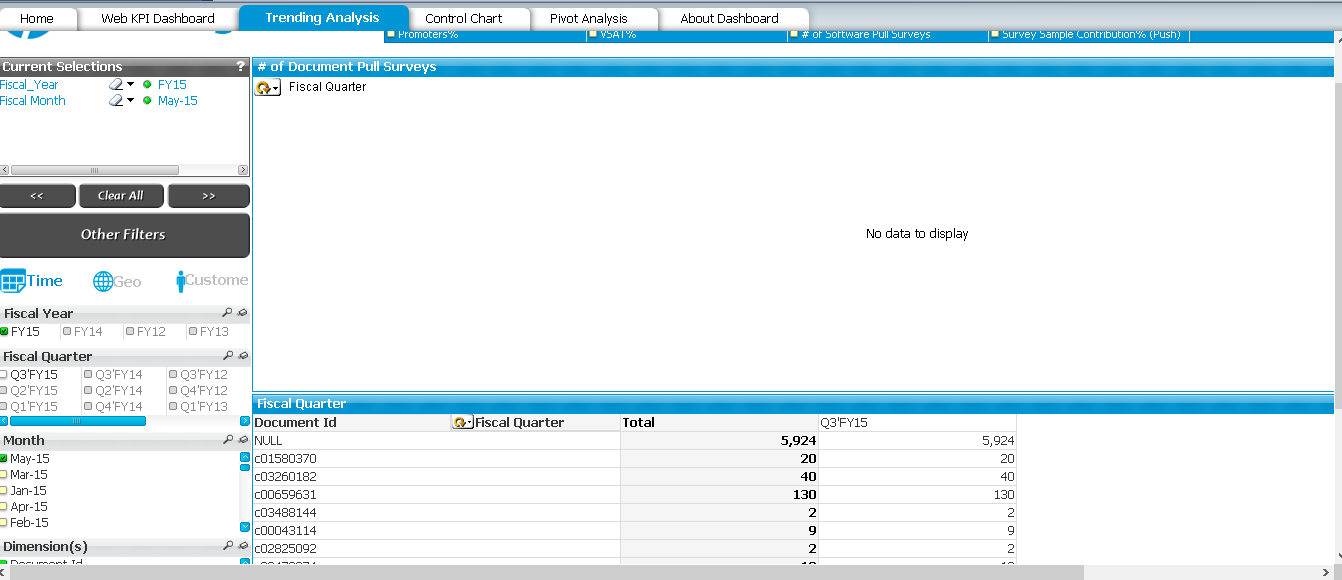
I am using one metric and dimension to see Chart representation. I have two charts Line chart and Pivot table, i can see data in pivot table but unable to see chart in Line Chart. While Clicking on Particular Document Id( Which is dimension in my dashboard.) i am able to see that chart in line chart. Facing problem when i am looking for entire month and for day wise detailed Graph.
The thing is i am able to see Line chart for few months and not for few other months.Please help me in this scenario.
Thanks,
Khaja Fareed.S
- Mark as New
- Bookmark
- Subscribe
- Mute
- Subscribe to RSS Feed
- Permalink
- Report Inappropriate Content
That's not enough information to really help you. If possible, upload a sample QVW that demonstrates your issue.
Just guessing around, but I would assume that one of your expressions is missing aggregation, so it will return NULL if you don't limit the records set to provide an unambiguous single result.
- Mark as New
- Bookmark
- Subscribe
- Mute
- Subscribe to RSS Feed
- Permalink
- Report Inappropriate Content
You can find the png file.
- Mark as New
- Bookmark
- Subscribe
- Mute
- Subscribe to RSS Feed
- Permalink
- Report Inappropriate Content
We don't need proof that the chart does not display - we believed you. We need to examine your qvw file or a representative sample to understand what is going wrong.