Unlock a world of possibilities! Login now and discover the exclusive benefits awaiting you.
- Qlik Community
- :
- All Forums
- :
- QlikView App Dev
- :
- Re: Problem with Line Charts and Bar charts!
- Subscribe to RSS Feed
- Mark Topic as New
- Mark Topic as Read
- Float this Topic for Current User
- Bookmark
- Subscribe
- Mute
- Printer Friendly Page
- Mark as New
- Bookmark
- Subscribe
- Mute
- Subscribe to RSS Feed
- Permalink
- Report Inappropriate Content
Problem with Line Charts and Bar charts!
Hi!
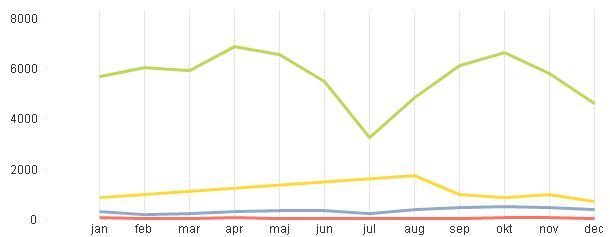
I think i have a wierd problem! When i use Bar chart you can see that the Yellow does not have values for Feb -> Jul and that is right. But in the Line chart the yellow line does have values over these month which is incorrect.
Thanksfull for help!

- « Previous Replies
- Next Replies »
- Mark as New
- Bookmark
- Subscribe
- Mute
- Subscribe to RSS Feed
- Permalink
- Report Inappropriate Content
Try unchecking continuous in axis tab.
-Sundar
- Mark as New
- Bookmark
- Subscribe
- Mute
- Subscribe to RSS Feed
- Permalink
- Report Inappropriate Content
Hi Erik,
that's just because, in a line chart, the data_points get connected automatically - a line is actually nothing else than dots (over the dimension_points) which are automatically connected.
=> A solution might be to somehow modify your formula so that, when there is no value, a 0 gets populated - that way, the line would plunge to 0 after Jan and go back up only in August.
HTH
Best regards,
DataNibbler
- Mark as New
- Bookmark
- Subscribe
- Mute
- Subscribe to RSS Feed
- Permalink
- Report Inappropriate Content
It is already unchecked.
- Mark as New
- Bookmark
- Subscribe
- Mute
- Subscribe to RSS Feed
- Permalink
- Report Inappropriate Content
I see, do you have any solution? I want exactly what you are explaining, that the line dips down to zero when there is no value!
- Mark as New
- Bookmark
- Subscribe
- Mute
- Subscribe to RSS Feed
- Permalink
- Report Inappropriate Content
in presentatioon uncheck "suppress zero value"
hope it helps
- Mark as New
- Bookmark
- Subscribe
- Mute
- Subscribe to RSS Feed
- Permalink
- Report Inappropriate Content
fill in the missing data points with zero value..
- Mark as New
- Bookmark
- Subscribe
- Mute
- Subscribe to RSS Feed
- Permalink
- Report Inappropriate Content
Im getting the information from a OBDC SQL server, so i dont see how i can do that 
- Mark as New
- Bookmark
- Subscribe
- Mute
- Subscribe to RSS Feed
- Permalink
- Report Inappropriate Content
Nope 😕
- Mark as New
- Bookmark
- Subscribe
- Mute
- Subscribe to RSS Feed
- Permalink
- Report Inappropriate Content
Btw. you can show additional dots on the line to marke the data points..
- « Previous Replies
- Next Replies »