Unlock a world of possibilities! Login now and discover the exclusive benefits awaiting you.
- Qlik Community
- :
- All Forums
- :
- QlikView App Dev
- :
- Re: Problem with Line Charts and Bar charts!
- Subscribe to RSS Feed
- Mark Topic as New
- Mark Topic as Read
- Float this Topic for Current User
- Bookmark
- Subscribe
- Mute
- Printer Friendly Page
- Mark as New
- Bookmark
- Subscribe
- Mute
- Subscribe to RSS Feed
- Permalink
- Report Inappropriate Content
Problem with Line Charts and Bar charts!
Hi!
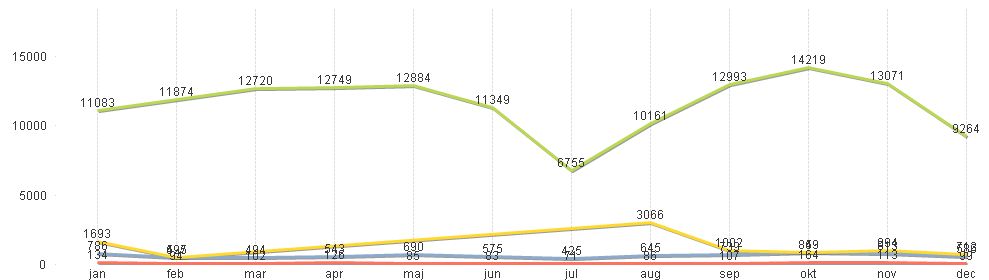
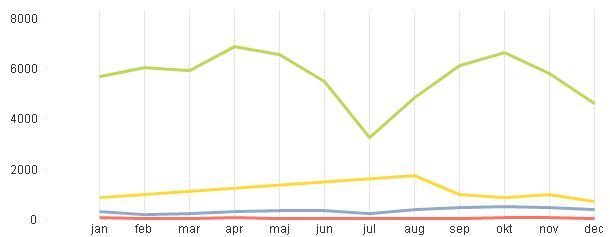
I think i have a wierd problem! When i use Bar chart you can see that the Yellow does not have values for Feb -> Jul and that is right. But in the Line chart the yellow line does have values over these month which is incorrect.
Thanksfull for help!

- Mark as New
- Bookmark
- Subscribe
- Mute
- Subscribe to RSS Feed
- Permalink
- Report Inappropriate Content
What does the chart look like? Is it at zero during those middle months?
- Mark as New
- Bookmark
- Subscribe
- Mute
- Subscribe to RSS Feed
- Permalink
- Report Inappropriate Content
Still as my first post, the line is connection between still known value and the latest value.
- Mark as New
- Bookmark
- Subscribe
- Mute
- Subscribe to RSS Feed
- Permalink
- Report Inappropriate Content
Check my attached qvw and see if it helps.
- Mark as New
- Bookmark
- Subscribe
- Mute
- Subscribe to RSS Feed
- Permalink
- Report Inappropriate Content
Sorry, I only got the Private licens so i cant open your file!
Anyone else got a input to this topic?
- Mark as New
- Bookmark
- Subscribe
- Mute
- Subscribe to RSS Feed
- Permalink
- Report Inappropriate Content
Hi Erik,
Just Enable the option Suppress When Value is Null Under Dimension Tab in properties of chart.
Thanks,
- Mark as New
- Bookmark
- Subscribe
- Mute
- Subscribe to RSS Feed
- Permalink
- Report Inappropriate Content
That does not help! Still the line is there and does not dip down top zero!
- Mark as New
- Bookmark
- Subscribe
- Mute
- Subscribe to RSS Feed
- Permalink
- Report Inappropriate Content
Try populating zero for july and uncheck Suppress zero values. The line chart will automatically get connected to zero for july month and you can visually find the difference. Line will not be upward, instead it will be like a V shape while crossing july alone.
- Mark as New
- Bookmark
- Subscribe
- Mute
- Subscribe to RSS Feed
- Permalink
- Report Inappropriate Content
Im reading data from a ODBC connection, so i will be hard for me to populate zero for a month..
But there is no values, i guess NULL for Mar, Apr, May, Juni, Juli.
But still i want the line to dip to zero and no create a line between the last known value and the value in Aug.
Thanksfull for all the help and suggestions! 
- Mark as New
- Bookmark
- Subscribe
- Mute
- Subscribe to RSS Feed
- Permalink
- Report Inappropriate Content
What is your Yellow Data for JAN , FEB ,.... DEC ? . So that we will guide you in a better way.
- Mark as New
- Bookmark
- Subscribe
- Mute
- Subscribe to RSS Feed
- Permalink
- Report Inappropriate Content