Unlock a world of possibilities! Login now and discover the exclusive benefits awaiting you.
- Qlik Community
- :
- All Forums
- :
- QlikView App Dev
- :
- Problem with chart expression
- Subscribe to RSS Feed
- Mark Topic as New
- Mark Topic as Read
- Float this Topic for Current User
- Bookmark
- Subscribe
- Mute
- Printer Friendly Page
- Mark as New
- Bookmark
- Subscribe
- Mute
- Subscribe to RSS Feed
- Permalink
- Report Inappropriate Content
Problem with chart expression
Hi,
I am new to Qlikview and having the following problem. I've got a table_1 with fields model type, timeframe, revenue type and US$ and another Table_2 with those models, maintenance start and serial number.
What I'd like to do is to create a chart with dimensions of C_DATE and REVENUE TYPE and a expression that shows all models according to its maintenance start, which is related to C_DATE.
an Example - table_1:
Model timeframe revenue type US$
aaaa 10 change tires 50
bbbb 55 change window 30
Table_2:
Model Maintenance start Serial Number
aaaaa 12/10/2015 22
aaaaa 13/10/2015 23
bbbbb 10/5/2015 11
If anyone can help me I would appreciate.
thanks
- Mark as New
- Bookmark
- Subscribe
- Mute
- Subscribe to RSS Feed
- Permalink
- Report Inappropriate Content
I do see REVENUE TYPE field, but I don't see C_DATE in your example? Can you also share your desired output?
- Mark as New
- Bookmark
- Subscribe
- Mute
- Subscribe to RSS Feed
- Permalink
- Report Inappropriate Content
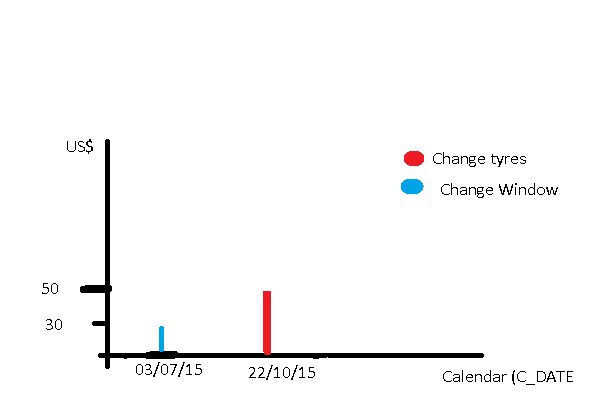
Yes!
C_DATE is a calendar containing all the dates from the year.
I drew a picture, attached.
Timeframe is given in days , so "maintenance start" plus "timeframe" equals to "day of maintenance".
- Mark as New
- Bookmark
- Subscribe
- Mute
- Subscribe to RSS Feed
- Permalink
- Report Inappropriate Content
Hi sunny. I had replied below.
In addition, I had also created a topic explaining better the desired result.
How to create another Column in script
Thanks