Unlock a world of possibilities! Login now and discover the exclusive benefits awaiting you.
- Qlik Community
- :
- All Forums
- :
- QlikView App Dev
- :
- Problem with combo chart
- Subscribe to RSS Feed
- Mark Topic as New
- Mark Topic as Read
- Float this Topic for Current User
- Bookmark
- Subscribe
- Mute
- Printer Friendly Page
- Mark as New
- Bookmark
- Subscribe
- Mute
- Subscribe to RSS Feed
- Permalink
- Report Inappropriate Content
Problem with combo chart
Hi,
Can anyone help me to solve the problem displaying the proper values of discount % as line.
I have created a combo chart in which, Avg of order price are represented as bar and discount % as line.
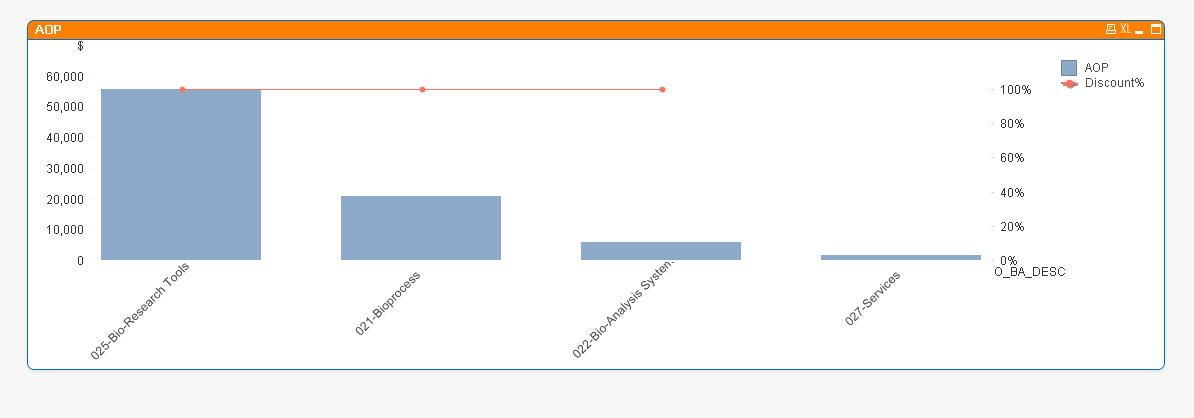
I am getting proper values for avg of order price but i am getting 100%(straight line) for discount ,
Can anyone explain me why i am getting straight line and please suggest me how can i display proper discount %.
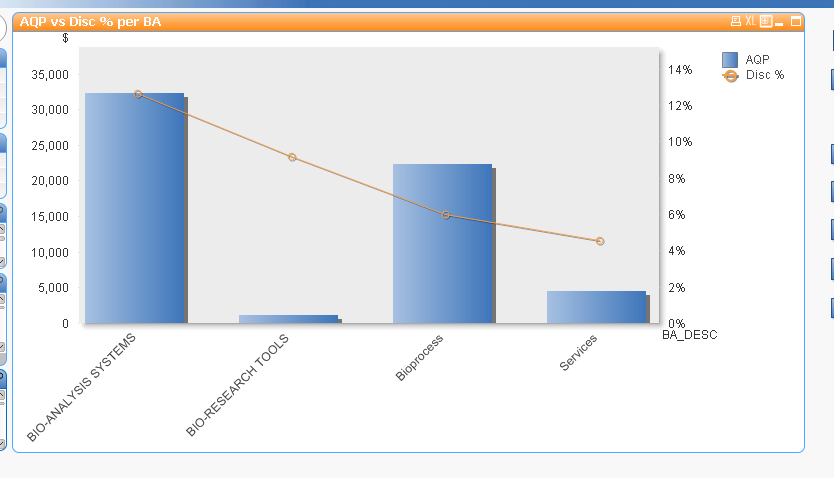
I want the graph as below:
Please find the values and formulas below for reference:

AOP=avg(ExtendedPrice)
vDiscount = (if(((sum(Order_List_Price)* sum(Orders_Quantity))-sum(ExtendedPrice))<0 or sum(ExtendedPrice)<0,0,(sum(Order_List_Price)* sum(Orders_Quantity))-sum(ExtendedPrice)))
Discount% = $(vDiscount) / Aggr((sum(Order_List_Price)*sum(Orders_Quantity)),O_BA_DESC)
- Tags:
- new_to_qlikview