Unlock a world of possibilities! Login now and discover the exclusive benefits awaiting you.
- Qlik Community
- :
- All Forums
- :
- QlikView App Dev
- :
- Problems viewing graph scatterplot by rank months
- Subscribe to RSS Feed
- Mark Topic as New
- Mark Topic as Read
- Float this Topic for Current User
- Bookmark
- Subscribe
- Mute
- Printer Friendly Page
- Mark as New
- Bookmark
- Subscribe
- Mute
- Subscribe to RSS Feed
- Permalink
- Report Inappropriate Content
Problems viewing graph scatterplot by rank months
Good morning everyone, I need your support in order to display a scatter plot I need to develop, the expressions that I use are:
Expr1: Only ({<[Year Time - Cost] = eaMarino :: [Year Time - Cost], Management = { 'Terrestrial'}, [Month Time - Cost] = { '> (= min ([Month Time - Cost ]) <(= max (eaMarino :: [Month Time - Cost]) '}>} [Actual Cost])
Expr2: Only ({<[Year Time - Cost] = eaMarino :: [Year Time - Cost], Management = { 'Terrestrial'}, [Month Time - Cost] = { '> (= min ([Month Time - Cost ]) <(= max (eaMarino :: [Month Time - Cost]) '}>} [Planned Cost])
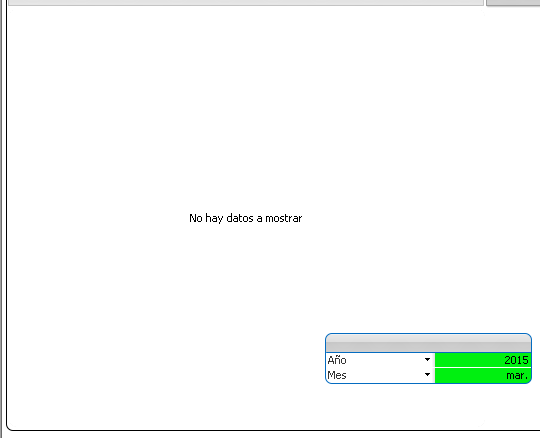
The detail that I have is that when I add the expression of the month ([Month Time - Cost] = { '> (= min ([Month Time - Cost]) <(= max (eaMarino :: [Month Time - Cost ]) '}), not shown the graph, show the leyend "no data to be displayed", but they do exist.
The data come from the selection in an alternate state called eaMarino.
in my condition I require is that to indicate a month, for example, the information is displayed March from January to March inclusive.
In advance thank you very much by support to my problem.
I look forward to your comments.
Kenneth Baeza
- Mark as New
- Bookmark
- Subscribe
- Mute
- Subscribe to RSS Feed
- Permalink
- Report Inappropriate Content
What is the format for [Month Time - Cost]? Format's need to match on the LHS and RHS of the set modifier. Min(Month) would be a number and wouldn't equal Jan, Feb, ... etc. So you need to somehow get the LHS and RHS in the same formats to get this working
- Mark as New
- Bookmark
- Subscribe
- Mute
- Subscribe to RSS Feed
- Permalink
- Report Inappropriate Content
Thanks for your comment Sunny T, both values have shaped the text, Jan, Feb, ..., I made the switch to numeric format by changing the value of MonthNames
SET MonthNames = '1; 2; 3; 4; 5; 6; 7; 8; 9; 10; 11; 12';
even so, I do not get to see the graph.
thanks for you support.
Kenneth Baeza
- Mark as New
- Bookmark
- Subscribe
- Mute
- Subscribe to RSS Feed
- Permalink
- Report Inappropriate Content
Would you be able to share a sample to look at the issue?
- Mark as New
- Bookmark
- Subscribe
- Mute
- Subscribe to RSS Feed
- Permalink
- Report Inappropriate Content
Of course, attached application, I use a Personal Edition version.
Regards.
Kenneth Baeza