Unlock a world of possibilities! Login now and discover the exclusive benefits awaiting you.
- Qlik Community
- :
- All Forums
- :
- QlikView App Dev
- :
- Problems with dashboard view
- Subscribe to RSS Feed
- Mark Topic as New
- Mark Topic as Read
- Float this Topic for Current User
- Bookmark
- Subscribe
- Mute
- Printer Friendly Page
- Mark as New
- Bookmark
- Subscribe
- Mute
- Subscribe to RSS Feed
- Permalink
- Report Inappropriate Content
Problems with dashboard view
I'm trying to put together a a dashboard, but I have a major problem. I want to show a chart with the YTD (year to date) and the other with the year over year (as per the image). I'm detaching the charts once I select the view, but when I close and reopen the file the detach option is gone, so I see all the charts filtered by the same view option
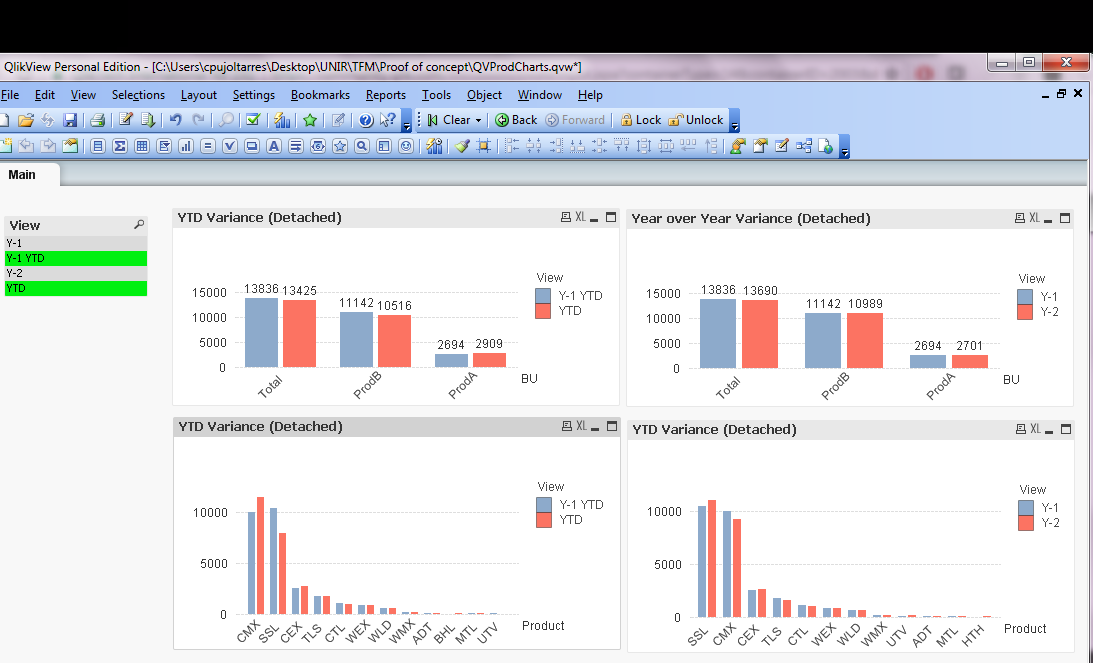
Also, is possible it possible for the charts below to filter on ProductA/B when clicking on the chart above?
Lastly, is it possible to have the chart showing the percentage variance. For example something like:
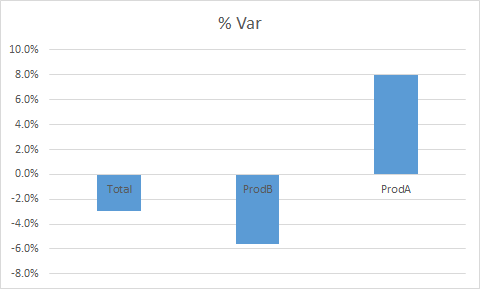
Thanks
- Mark as New
- Bookmark
- Subscribe
- Mute
- Subscribe to RSS Feed
- Permalink
- Report Inappropriate Content
detach option will only last until your current session
if you want to ignore selections add {1} to you set expression as below
Sum({1} Sales)
If a post helps to resolve your issue, please accept it as a Solution.