- Mark as New
- Bookmark
- Subscribe
- Mute
- Subscribe to RSS Feed
- Permalink
- Report Inappropriate Content
Put the formula from field into dollar sign expansion - and calculate it in expression of a chart
Dear QV Fellows:
Probably found another thing QV is unable to do. Here is a similar problem.
Have you ever dealt with the formulas that you fed into Expression from a [metadata] table and dynamically calculated them depending on the dimensions? Below the detail.
We have this problem:
0. I am trying to implement a robust data structure, where it's possible to define formulas in a table and then use them dynamically in the same expression of a pivot. I know if you put a formula in dollar sign expansion, it will get evaluated. So I need to evaluate all the formulas at the same time.
1. The table below is a dummy table that illustrates my need. Column [Formula] contains the formula to evaluate the particular KPI.
Of course the real formulas will be like SUM(Col) etc., but now simple expressions are enough to showcase the point.
[KPI formulas]:
LOAD * INLINE [
KPI ID, Formula
KPI1, 10/3
KPI2, 30/4
];
So now I need to have a pivot that will act as follows:
| KPI ID | Value | Explanation |
|---|---|---|
| KPI1 | 3.333 | it evaluated the contents of Formula column, which is 10/3 = 3.333 |
| KPI2 | 7.5 | ditto, 30/4 = 7.5 |
I start building this:
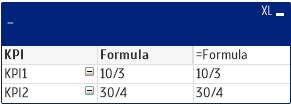
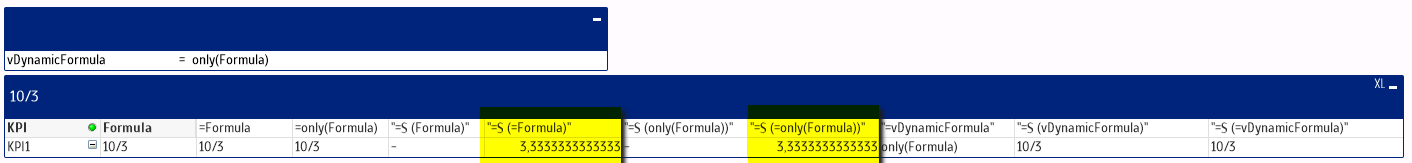
1. If I put =Formula in expressions, it outputs the content of the field as I expect:
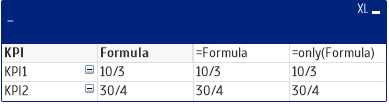
2. If I put =only(Formula) in expressions, it also outputs the content of the field:
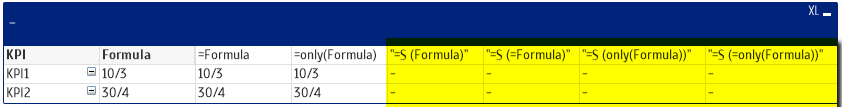
3. Ok, then we are ready for some dollar-sign expansion. And it does not work!
4. Ok, how about putting the ref to formula in a variable and instead calculate the variable.
So I create variable vDynamicFormula and set it to "only(Formula)". Now trying to make use of it in the pivot. Not working.
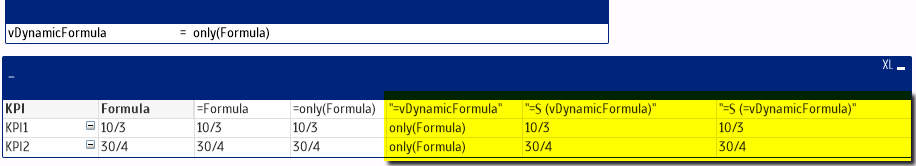
If I only select 1 KPI, it gives me the expected result, though:
But this is not accomplishing the goal.
ALL KPIs need to be calculated and displayed at the same time.
Ok, many people told me that the dollar sign expansions expand only once per chart. Which means: if you have more variants of the contents of dollar sign expansion, you won't get anything.
Possible solution: multi-level IF statement. It works, but imagine 30 nested IFs if you have 30 KPIs. This is not beautiful.
QVD attached.
Accepted Solutions
- Mark as New
- Bookmark
- Subscribe
- Mute
- Subscribe to RSS Feed
- Permalink
- Report Inappropriate Content
You can find in the attached QVW 2 solutions :
(expression only. For both solutions we added in the script a self-generated Id, to keep it simple.)
- the first one uses pick , as suggested also by yourself, Igor
We've used this solution in production for a while with auto-generated (in the script) veeeery long crazy formulas, but the interface performance is poor.
=pick(Id,$(=concat(distinct all Formula,',')))
- the second one adds the evaluations that is valid for each situations. We did some tests for changing the first (pick) solution and it seems to be far better in performance, even though the script to generate will become a little bit more complicated
=sum({<Id={1}>} $(=only({<Id={1}>} Formula)))+sum({<Id={2}>} $(=only({<Id={2}>} Formula)))
You will notice that activating a selection is generating different behaviour with these solutions.
- Mark as New
- Bookmark
- Subscribe
- Mute
- Subscribe to RSS Feed
- Permalink
- Report Inappropriate Content
Possible workaround is with pick, which is feasible and works: Using formulas from excel in the straight table
- Mark as New
- Bookmark
- Subscribe
- Mute
- Subscribe to RSS Feed
- Permalink
- Report Inappropriate Content
Hi,
Do you mind to try this in script level? Like
[KPI formulas]:
Load KPI,Formula,Evaluate(Formula) as New;
LOAD * INLINE [
KPI, Formula
KPI1, 10/3
KPI2, 30/4
];
- Mark as New
- Bookmark
- Subscribe
- Mute
- Subscribe to RSS Feed
- Permalink
- Report Inappropriate Content
You can find in the attached QVW 2 solutions :
(expression only. For both solutions we added in the script a self-generated Id, to keep it simple.)
- the first one uses pick , as suggested also by yourself, Igor
We've used this solution in production for a while with auto-generated (in the script) veeeery long crazy formulas, but the interface performance is poor.
=pick(Id,$(=concat(distinct all Formula,',')))
- the second one adds the evaluations that is valid for each situations. We did some tests for changing the first (pick) solution and it seems to be far better in performance, even though the script to generate will become a little bit more complicated
=sum({<Id={1}>} $(=only({<Id={1}>} Formula)))+sum({<Id={2}>} $(=only({<Id={2}>} Formula)))
You will notice that activating a selection is generating different behaviour with these solutions.
- Mark as New
- Bookmark
- Subscribe
- Mute
- Subscribe to RSS Feed
- Permalink
- Report Inappropriate Content
Thank you very much Cotiso. The set analysis approach does exactly what I expect!
Also agreed that it performs faster. From my experience, Set Analysis is preferred over IF or PICK.
The workflow will be as follows:
- Load the KPI formula table
- Loop through the KPI formula table to get all 30 KPIs into a variable in the Set Analysis format that you suggested (there is a code snippet here that I will use: Using formulas from excel in the straight table)
- Use the variable in the chart
Again, much appreciated!