Unlock a world of possibilities! Login now and discover the exclusive benefits awaiting you.
- Qlik Community
- :
- All Forums
- :
- QlikView App Dev
- :
- QlikView - can you use a row's field value in set ...
- Subscribe to RSS Feed
- Mark Topic as New
- Mark Topic as Read
- Float this Topic for Current User
- Bookmark
- Subscribe
- Mute
- Printer Friendly Page
- Mark as New
- Bookmark
- Subscribe
- Mute
- Subscribe to RSS Feed
- Permalink
- Report Inappropriate Content
QlikView - can you use a row's field value in set analysis
I'm hoping this is possible. I have the following chart below I am trying to build. The dimension is a data island I created to drive what date range I am interested in for my metrics (it is not linked to my data model). Basically I want to get counts of "x" for a 5 day time frame, and that time frame change daily (it is a rolling 5 work day data island/table).
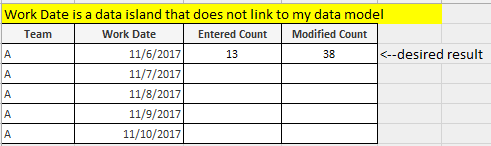
Can I use the respective row values for Work Date in set analysis so I can get the proper count of dates for each row above? So for example, I want to get the count of "x" where the Entry Date equals the Work Date for the respective row above.
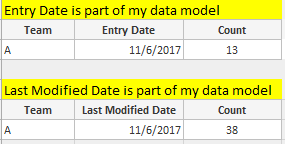
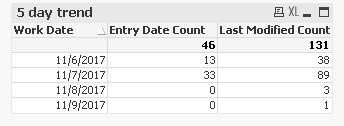
Below are charts that were generated using date fields from my data model and are shown here to help make this more understandable.
And if set analysis cannot be used, are there other approaches? Thanks.
- Tags:
- set analysis
Accepted Solutions
- Mark as New
- Bookmark
- Subscribe
- Mute
- Subscribe to RSS Feed
- Permalink
- Report Inappropriate Content
- Mark as New
- Bookmark
- Subscribe
- Mute
- Subscribe to RSS Feed
- Permalink
- Report Inappropriate Content
May be this? Using straight table
Add Dimensions from your Island table.
Expr:
= Sum({< WorkDate = {"$(= [Entry Date])"} >} EntryCount)
= Sum({< WorkDate = {"$(= [Modified Date])"} >} ModifiedCount)
If this is not what you are getting, can you share some sample data to look into. ?
- Mark as New
- Bookmark
- Subscribe
- Mute
- Subscribe to RSS Feed
- Permalink
- Report Inappropriate Content
Thanks for the quick reply. I tried something similar to what you provided and still am unsuccessful. I attached a sample qvw, hopefully that helps troubleshooting efforts. Thanks.
- Mark as New
- Bookmark
- Subscribe
- Mute
- Subscribe to RSS Feed
- Permalink
- Report Inappropriate Content
Let me know if this is what you are looking for?
Check attached.
- Mark as New
- Bookmark
- Subscribe
- Mute
- Subscribe to RSS Feed
- Permalink
- Report Inappropriate Content
Thanks, this should do it. I'm not sure why I didn't think to try a simple IF test; I made it harder than it had to be.