Unlock a world of possibilities! Login now and discover the exclusive benefits awaiting you.
- Qlik Community
- :
- All Forums
- :
- QlikView App Dev
- :
- QlikView not filtering data properly
- Subscribe to RSS Feed
- Mark Topic as New
- Mark Topic as Read
- Float this Topic for Current User
- Bookmark
- Subscribe
- Mute
- Printer Friendly Page
- Mark as New
- Bookmark
- Subscribe
- Mute
- Subscribe to RSS Feed
- Permalink
- Report Inappropriate Content
QlikView not filtering data properly
Hello,
I have the following tables
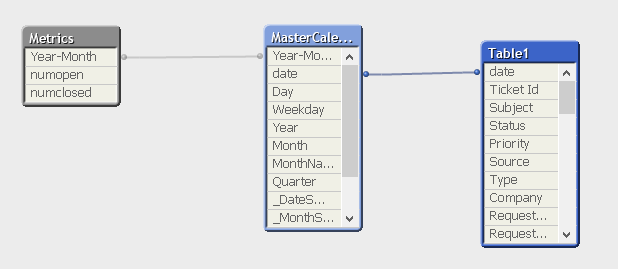
The table Metrics is a result of concatenating two separate tables that count the number of tickets opened and closed.
OpenTickets:
Load
count(monthopened) as numopen,
monthopened as [Year-Month]
Resident Table1
GROUP BY monthopened;


ClosedTickets:
Load
count(monthresolved) as numclosed,
monthresolved as [Year-Month]
Resident Table1
GROUP BY monthresolved;


Metrics:
NoConcatenate
load *
resident ClosedTickets;
CONCATENATE
load *
resident OpenTickets;


DROP TABLE ClosedTickets;
DROP TABLE OpenTickets;
The fields monthresolved and monthopened are available in Table1 and they match the format of the Year-Month field in the MasterCalendar. The MasterCalendar is generated using qvc.calendarfromfield.
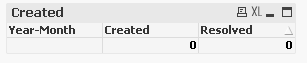
I put the content of table Metrics in a straight table, where dimension is Year-Month and expressions are SUM of numclosed and numopened. My problem is that whenever I filter the data using any field in Table1, the straight table blanks out, which seems to me a problem in the relation between the two tables.
Anything you suggest to solve this issue?
Thank you very much
- « Previous Replies
-
- 1
- 2
- Next Replies »
- Mark as New
- Bookmark
- Subscribe
- Mute
- Subscribe to RSS Feed
- Permalink
- Report Inappropriate Content
Appreciate any feedback.
Thank you
- Mark as New
- Bookmark
- Subscribe
- Mute
- Subscribe to RSS Feed
- Permalink
- Report Inappropriate Content
Yes it looked that there are no always proper associations between the tables respectively between the data-fields within your Table1. If there are no massive problems with the performance I wouldn't pre-calculate this within the script and just using a count-function within the chart-objects - and are there any performance issues you need to consider more factors on the datamodel to improve the performance.
- Marcus
- Mark as New
- Bookmark
- Subscribe
- Mute
- Subscribe to RSS Feed
- Permalink
- Report Inappropriate Content
Hello marcus_sommer,
Thanks for your reply.
My initial solution involved counting within the chart object. The problem is with the x-axis.
When I plot 1 line for count of opened cases (ex count [Ticket Id]), and 1 line for count of closed cases (ex. count of [Date Resolved], or count [Ticket Id] when [Date Resolved] is not empty), while the x-axis is using the case [Creation Date], the count of closed cases is not showing correct values as it is using a wrong date.
- Mark as New
- Bookmark
- Subscribe
- Mute
- Subscribe to RSS Feed
- Permalink
- Report Inappropriate Content
Kind reminder.
- Mark as New
- Bookmark
- Subscribe
- Mute
- Subscribe to RSS Feed
- Permalink
- Report Inappropriate Content
The format of Year-Month is the same in Metrics and within the Master-Calendar but are also the values there the same? The matching will happens on the numerical/string values and not on the formattings and if one is numeric and the other is a string or one is a date and the other is a timestamp it won't match.
- Marcus
- Mark as New
- Bookmark
- Subscribe
- Mute
- Subscribe to RSS Feed
- Permalink
- Report Inappropriate Content
Hello Marcus,
So I am reading the data from a XLS sheet, while doing that, I am converting some strings into date and then into a specific format.
RawData:
LOAD [Ticket Id],
[...]
Date(date#([Created Time], 'YYYY-MM-DD hh:mm:ss'), 'YYYY-MM-DD') as [Created Date],
Date(date#([Resolved Time], 'YYYY-MM-DD hh:mm:ss'), 'YYYY-MM-DD') as [Resolved Date],
[...]
Date(Floor(MonthEnd([Created Time])),'YYYY-MMM') as monthopened,
Date(Floor(MonthEnd([Resolved Time])),'YYYY-MMM') as monthresolved
FROM
file.xls
[...]
I also tried it this way as I am assuming Master-Calendar has Year-Month as a string.
Text(Date(Floor(MonthEnd([Created Time])),'YYYY-MMM')) as monthopened,
Text(Date(Floor(MonthEnd([Resolved Time])),'YYYY-MMM')) as monthresolved
Thanks
- Mark as New
- Bookmark
- Subscribe
- Mute
- Subscribe to RSS Feed
- Permalink
- Report Inappropriate Content
The script for date and Year-Month in Table1 and MasterCalendar respectively may be more helpful.
- Mark as New
- Bookmark
- Subscribe
- Mute
- Subscribe to RSS Feed
- Permalink
- Report Inappropriate Content
I'm not sure but I think that your values are further different. I believe the easiest way to find those differences and to create valid keys would be to remove any formattings from the KEY's - this meant to create keys which are only serving the purpose to be a key to associate the tables and within the UI you used additional fields (which then are formatted like you want).
- Marcus
- Mark as New
- Bookmark
- Subscribe
- Mute
- Subscribe to RSS Feed
- Permalink
- Report Inappropriate Content
Hello,
The MasterCalendar is generated using the following QVC
$(Include=qvc.qvs)
call qvc.calendarfromfield('date');
call Qvc.Cleanup;
I am putting the script together here below
Table1:
LOAD [Ticket Id],
  [...]
    date(date#([Created Time], 'YYYY-MM-DD hh:mm:ss'), 'YYYY-MM-DD') as [Created Date],
    date(date#([Resolved Time], 'YYYY-MM-DD hh:mm:ss'), 'YYYY-MM-DD') as [Resolved Date],
[...]
    Date(Floor([Created Time]),'YYYY-MM-DD') as date,
    Date(Floor(MonthEnd([Created Time])),'YYYY-MMM') as monthopened,
    Date(Floor(MonthEnd([Resolved Time])),'YYYY-MMM') as monthresolved
FROM
[file.xls]
(biff, embedded labels);

$(Include=qvc.qvs)
call qvc.calendarfromfield('date');
call Qvc.Cleanup;

OpenTickets:
Load
count(monthopened) as numopen,
monthopened as [Year-Month]
Resident Table1
GROUP BY monthopened;

ClosedTickets:
Load
count(monthresolved) as numclosed,
monthresolved as [Year-Month]
Resident Table1
GROUP BY monthresolved;

Metrics:
NoConcatenate
load *
resident ClosedTickets;
CONCATENATE
load *
resident OpenTickets;

DROP TABLE ClosedTickets;
DROP TABLE OpenTickets;
- « Previous Replies
-
- 1
- 2
- Next Replies »