Unlock a world of possibilities! Login now and discover the exclusive benefits awaiting you.
- Qlik Community
- :
- All Forums
- :
- QlikView App Dev
- :
- Re: Qlikview Report with multiple charts
- Subscribe to RSS Feed
- Mark Topic as New
- Mark Topic as Read
- Float this Topic for Current User
- Bookmark
- Subscribe
- Mute
- Printer Friendly Page
- Mark as New
- Bookmark
- Subscribe
- Mute
- Subscribe to RSS Feed
- Permalink
- Report Inappropriate Content
Qlikview Report with multiple charts
Dear all,
I am creating a page for showing outputs of various workcenters. We have around 100 workcenters.
I usually work with filters so that one can choose the workcenter from the list and the correspondig values will be shown on the chart.
I have a different situation now. I need to make a report which shows all the 100 Workcenters. I have only one chart object in Qlikview.
Is there any way to achieve this other than copying the object 100 times for each workcenter.
Thanks and Regards
Vaithee
Accepted Solutions
- Mark as New
- Bookmark
- Subscribe
- Mute
- Subscribe to RSS Feed
- Permalink
- Report Inappropriate Content
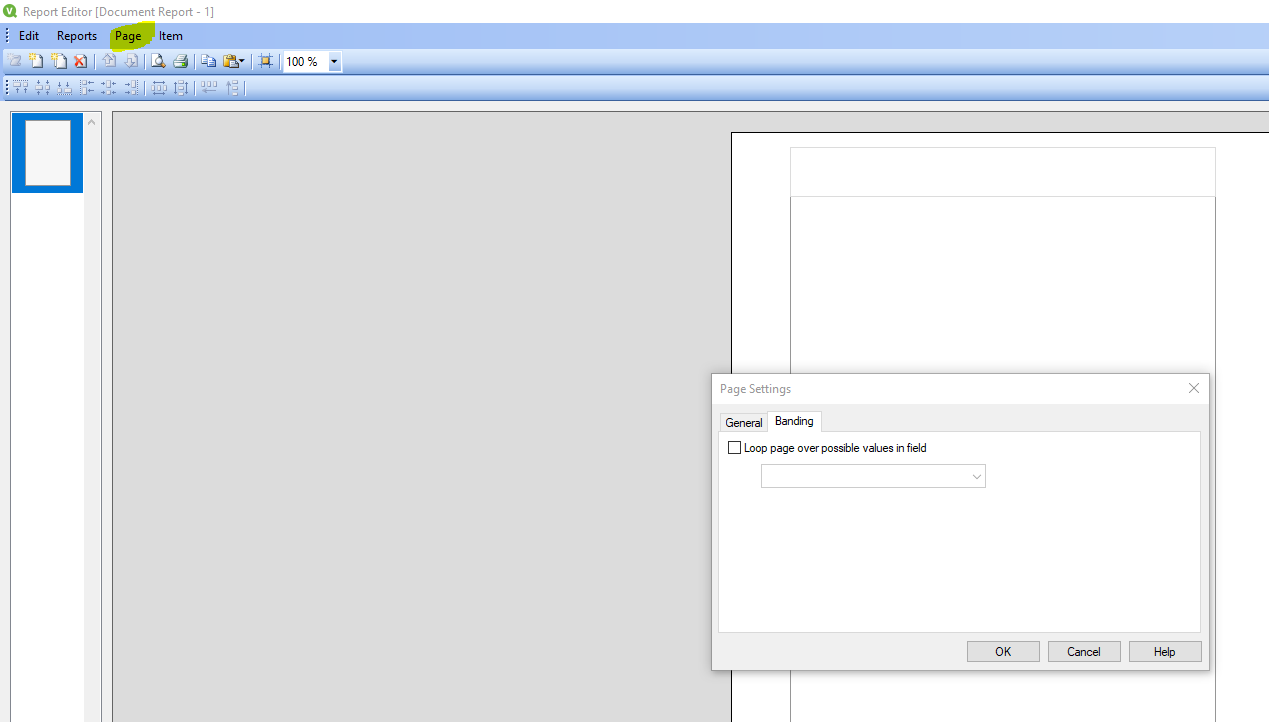
In the report editor in the page --> Page settings you would find a tab called banding.
Loop over the workcenters.
- Mark as New
- Bookmark
- Subscribe
- Mute
- Subscribe to RSS Feed
- Permalink
- Report Inappropriate Content
In the report editor in the page --> Page settings you would find a tab called banding.
Loop over the workcenters.
- Mark as New
- Bookmark
- Subscribe
- Mute
- Subscribe to RSS Feed
- Permalink
- Report Inappropriate Content
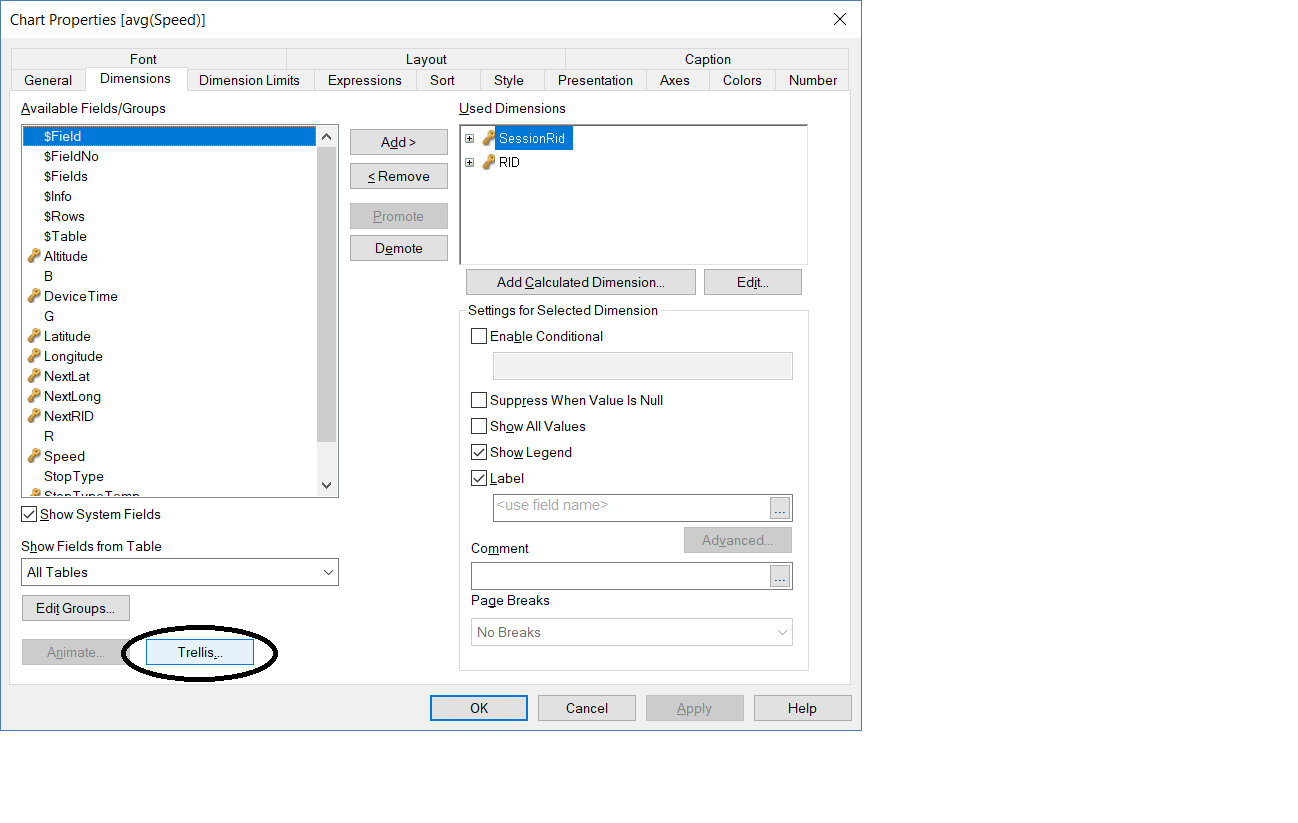
if
you want one chart for each work center you can use trellis
you define the workcenter as first dimension and than activate the trellis
- Mark as New
- Bookmark
- Subscribe
- Mute
- Subscribe to RSS Feed
- Permalink
- Report Inappropriate Content
if you created 100 objects means put all them in container, if you didn't create 100 objects then you can go with trellis
chart as liron said in above solution.
trellis good way to approach for this issue
- Mark as New
- Bookmark
- Subscribe
- Mute
- Subscribe to RSS Feed
- Permalink
- Report Inappropriate Content
Thank you. That is exactly what i was looking for.
- Mark as New
- Bookmark
- Subscribe
- Mute
- Subscribe to RSS Feed
- Permalink
- Report Inappropriate Content
Thank you so much for the answer. I have something new form you. I tried trellising. But i found the solution with banding while printing perfect for me as i want to show four different KPIs per workcenter. With trellis it would be too much to handle.
- Mark as New
- Bookmark
- Subscribe
- Mute
- Subscribe to RSS Feed
- Permalink
- Report Inappropriate Content
Thanks you Manoranjan. I have opted for the "banding" option as it suits my purpose well.