Unlock a world of possibilities! Login now and discover the exclusive benefits awaiting you.
- Qlik Community
- :
- All Forums
- :
- QlikView App Dev
- :
- Qlikview and week 53 year 2016?
- Subscribe to RSS Feed
- Mark Topic as New
- Mark Topic as Read
- Float this Topic for Current User
- Bookmark
- Subscribe
- Mute
- Printer Friendly Page
- Mark as New
- Bookmark
- Subscribe
- Mute
- Subscribe to RSS Feed
- Permalink
- Report Inappropriate Content
Qlikview and week 53 year 2016?
Hello!
I am having a big trouble with my QlikView viz.
The viz is showing now weekly based trendlines and we are compering lines between years.
The problem is that the year 2016 line continues all the way to the week 53, that obviously has not yet reached for this year.
This is some ISO-date problems within the program.. Is there any solutions how this can be fixed?
I am using the QlikView Mastercalendar code to generate dates based on my own datefield.
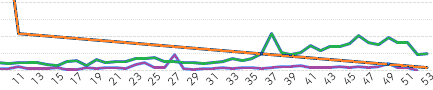
The orange line is the problem here... The straight line from week 11 to the week 53 should not be there.
Cheers,
Niko
- « Previous Replies
-
- 1
- 2
- Next Replies »
Accepted Solutions
- Mark as New
- Bookmark
- Subscribe
- Mute
- Subscribe to RSS Feed
- Permalink
- Report Inappropriate Content
Hi Niko,
I think you should also use a WeekYear field in your set expression field modiifer then:
=if(isNull(GetFieldSelections(Year)),sum({<WeekYear2={"$(vMaxYear)"}, Week=>} Value), sum({<WeekYear2={$(=Max(Vuosi))}, Week=>} Value))
Maybe your GetFieldSelections should also check on a WeekYear field, not sure what this expression should actually do.
- Mark as New
- Bookmark
- Subscribe
- Mute
- Subscribe to RSS Feed
- Permalink
- Report Inappropriate Content
I think you should use a year field for your graph created with WeekYear() function, instead of just Year():
The year to which the week number belongs. The week number ranges between 1 and approximately 52. Some years week #1 starts in December, e.g. December 1997. Other years start with week #53 of previous year, e.g. January 1999. For those few days when the week number belongs to another year, the functions year and weekyear will return different values.
Examples:
weekyear( '1996-12-30' ) returns 1997.
weekyear( '1997-01-02' ) returns 1997.
weekyear( '1997-12-30' ) returns 1997.
weekyear( '1999-01-02' ) returns 1998.
- Mark as New
- Bookmark
- Subscribe
- Mute
- Subscribe to RSS Feed
- Permalink
- Report Inappropriate Content
Hello,
Thank you for your input, I will look on to that.
I currently have two dimensions for time and they are as follows in this order:
=if(len(WeekYear)=6,left(WeekYear,1),left(WeekYear,2))
=right(WeekYear,4)
And the WeekYear is a field from the MasterCalendar.
Cheers,
Niko
- Mark as New
- Bookmark
- Subscribe
- Mute
- Subscribe to RSS Feed
- Permalink
- Report Inappropriate Content
How is WeekYear created in the script, i.e. is the Year based on Year(Date) or WeekYear(Date)?
- Mark as New
- Bookmark
- Subscribe
- Mute
- Subscribe to RSS Feed
- Permalink
- Report Inappropriate Content
Hello,
It is generated like Week(weekstart(TempDate)) & '-' & WeekYear(TempDate) as WeekYear,
Cheers,
Niko
- Mark as New
- Bookmark
- Subscribe
- Mute
- Subscribe to RSS Feed
- Permalink
- Report Inappropriate Content
I can't reproduce the issue with some simple data, the line only gets to week 53 in year 2016 when the 'standard' year is used.
Could you upload a small sample QVW?
edit: Attached my sample.
- Mark as New
- Bookmark
- Subscribe
- Mute
- Subscribe to RSS Feed
- Permalink
- Report Inappropriate Content
Hmm, thank you for your sample workbook.
I am also having 3 different expressions on my chart, may that 'cause the false line on the chart?
This is expression for the line that shows two years back:
=if(isNull(GetFieldSelections(Year)),sum({<Year={"$(vMaxYearMinus2)"}, Week=>} #1), sum({<Year={$(=Max(Year-2))}, Week=>}#1))
I have these expressions 3 times, for each "year". Current, current-1 and current-2.
And this is for that the lines will dynamically change when user makes selections. And as a default we show the value with variable.
Maybe not the best way to do it, but it works for the purpose 
Cheers,
Niko
- Mark as New
- Bookmark
- Subscribe
- Mute
- Subscribe to RSS Feed
- Permalink
- Report Inappropriate Content
Yep, when I removed the 3 custom expressions, it showed the year 2016 without the long line to the week 53.
But this removes my filtering for 3 top years ...
Cheers,
Niko
- Mark as New
- Bookmark
- Subscribe
- Mute
- Subscribe to RSS Feed
- Permalink
- Report Inappropriate Content
Well actually when selecting year 2016 from the filters, it will show a dot on the timeline for week 53 alltho' it is colored for year 2015. Odd.
Cheers,
Niko
- Mark as New
- Bookmark
- Subscribe
- Mute
- Subscribe to RSS Feed
- Permalink
- Report Inappropriate Content
Could you update my sample file that it matches your setting and demonstrates your issue?
Then upload it to this thread, please.
- « Previous Replies
-
- 1
- 2
- Next Replies »