Unlock a world of possibilities! Login now and discover the exclusive benefits awaiting you.
- Qlik Community
- :
- All Forums
- :
- QlikView App Dev
- :
- QoQ Growth calculation using multiple dimensions i...
- Subscribe to RSS Feed
- Mark Topic as New
- Mark Topic as Read
- Float this Topic for Current User
- Bookmark
- Subscribe
- Mute
- Printer Friendly Page
- Mark as New
- Bookmark
- Subscribe
- Mute
- Subscribe to RSS Feed
- Permalink
- Report Inappropriate Content
QoQ Growth calculation using multiple dimensions in StraightTable
I have sample data associated as below.
| DIMENSIONS | EXPRESSION | |||||||||
DIV | FLAG | PARENT_GRP | CHILD_GRP | O_LOB | F_LOB | REPORT_YEAR | REPORT_QUARTER | D_YEAR | D_MONTH | AMOUNT |
|---|---|---|---|---|---|---|---|---|---|---|
| 10 | A | P1 | C1 | LOB1 | FLOB1 | 1995 | 091995 | 1995 | 071995 | 100 |
| 10 | A | P1 | C1 | LOB1 | FLOB1 | 1995 | 091995 | 1995 | 081995 | 150 |
| 10 | A | P1 | C1 | LOB1 | FLOB1 | 1995 | 121995 | 1995 | 071995 | 200 |
| 10 | A | P1 | C1 | LOB1 | FLOB1 | 1995 | 121995 | 1995 | 081995 | 100 |
| 10 | A | P1 | C1 | LOB1 | FLOB1 | 1996 | 031996 | 1995 | 071995 | 300 |
| 10 | A | P1 | C1 | LOB1 | FLOB1 | 1996 | 031996 | 1995 | 081995 | 350 |
| 10 | A | P1 | C1 | LOB1 | FLOB1 | 1996 | 061996 | 1995 | 081995 | 400 |
| 10 | A | P1 | C1 | LOB1 | FLOB1 | 1996 | 061996 | 1995 | 091995 | 450 |
| 10 | A | P1 | C1 | LOB1 | FLOB1 | 1996 | 061996 | 1995 | 111995 | 500 |
| 10 | A | P1 | C1 | LOB1 | FLOB1 | 1996 | 091996 | 1995 | 011995 | 550 |
| 10 | A | P1 | C1 | LOB1 | FLOB1 | 1996 | 091996 | 1995 | 061995 | 600 |
| 10 | A | P1 | C1 | LOB1 | FLOB1 | 1996 | 091996 | 1995 | 081995 | 650 |
| 10 | A | P1 | C1 | LOB1 | FLOB1 | 1996 | 091996 | 1995 | 091995 | 700 |
| 10 | A | P1 | C1 | LOB1 | FLOB1 | 1996 | 091996 | 1995 | 101995 | 750 |
| 10 | A | P1 | C1 | LOB1 | FLOB1 | 1996 | 091996 | 1995 | 111995 | 800 |
| 10 | A | P1 | C1 | LOB1 | FLOB1 | 1996 | 121996 | 1995 | 081995 | 500 |
| 10 | B | P1 | C2 | LOB1 | FLOB1 | 1995 | 031995 | 1995 | 011995 | 100 |
| 10 | B | P1 | C2 | LOB1 | FLOB1 | 1995 | 061995 | 1995 | 011995 | 200 |
| 10 | B | P1 | C2 | LOB1 | FLOB1 | 1996 | 091996 | 1995 | 011995 | 200 |
| 20 | A | P2 | C1 | LOB1 | FLOB1 | 1996 | 121996 | 1995 | 081995 | 100 |
| 20 | A | P2 | C1 | LOB2 | FLOB2 | 1996 | 091996 | 1995 | 081995 | 300 |
| 20 | B | P2 | C1 | LOB3 | FLOB3 | 1996 | 121996 | 1995 | 091995 | 400 |
I want to calculate Quarterly growth AMOUNT for each quarter of 'REPORT_QUARTER' based on maximum of 'D_MONTH' for all years of 'REPORT_YEAR' based on dimensions DIV, FLAG, P_GRP, C_GRP, O_LOB, F_LOB, REPORT_YEAR, REPORT_QUARTER.
I want to display the result data in straight table as below for DIV=10, FLAG=A, P_GRP=P1, C_GRP=C1, O_LOB=LOB1, F_LOB=FLOB1 for all years. With below REPORT_YEAR, QUARTER multibox filter.
| Multibox Filter (For understdng, not to display in table) | Dimensions | Expression | Expression | |||||||||
REPORT_ YEAR | REPORT_ QUARTER | DIV | FLAG | P_GRP | C_GRP | O_LOB | F_LOB | D_YEAR | D_MONTH | AMOUNT | Quarterly GROWTH | Calculation for understanding |
|---|---|---|---|---|---|---|---|---|---|---|---|---|
| 1995 | 091995 | 10 | A | P1 | C1 | LOB1 | FLOB1 | 1995 | 071995 | 100 | - | |
| 1995 | 091995 | 10 | A | P1 | C1 | LOB1 | FLOB1 | 1995 | 081995 | 150 | - | |
| 1995 | 121995 | 10 | A | P1 | C1 | LOB1 | FLOB1 | 1995 | 071995 | 200 | - | |
| 1995 | 121995 | 10 | A | P1 | C1 | LOB1 | FLOB1 | 1995 | 081995 | 100 | -50 | (100-150) |
| 1996 | 031996 | 10 | A | P1 | C1 | LOB1 | FLOB1 | 1995 | 071995 | 300 | - | |
| 1996 | 031996 | 10 | A | P1 | C1 | LOB1 | FLOB1 | 1995 | 081995 | 350 | 250 | (350-100) |
| 1996 | 061996 | 10 | A | P1 | C1 | LOB1 | FLOB1 | 1995 | 081995 | 400 | - | |
| 1996 | 061996 | 10 | A | P1 | C1 | LOB1 | FLOB1 | 1995 | 091995 | 450 | - | |
| 1996 | 061996 | 10 | A | P1 | C1 | LOB1 | FLOB1 | 1995 | 111995 | 500 | 150 | (500-350) |
| 1996 | 091996 | 10 | A | P1 | C1 | LOB1 | FLOB1 | 1995 | 011995 | 550 | - | |
| 1996 | 091996 | 10 | A | P1 | C1 | LOB1 | FLOB1 | 1995 | 061995 | 600 | - | |
| 1996 | 091996 | 10 | A | P1 | C1 | LOB1 | FLOB1 | 1995 | 081995 | 650 | - | |
| 1996 | 091996 | 10 | A | P1 | C1 | LOB1 | FLOB1 | 1995 | 091995 | 700 | - | |
| 1996 | 091996 | 10 | A | P1 | C1 | LOB1 | FLOB1 | 1995 | 101995 | 750 | - | |
| 1996 | 091996 | 10 | A | P1 | C1 | LOB1 | FLOB1 | 1995 | 111995 | 800 | 300 | (800-500) |
| 1996 | 121996 | 10 | A | P1 | C1 | LOB1 | FLOB1 | 1995 | 081995 | 500 | -300 | (500-800) |
If user select year '1995', user should be able to see Quarterly GROWTH of -50 which is based on latest D_MONTH '081995' of REPORT_QUARTER's 091995 & 121995, likewise for other years.
Can anybody please help. Thanks in Advance. Thanks for your time.
Note: I cannot paste screenshot or developed application due to environment restrictions and confidentiality of data.
You can take the above table data as below.
Load *,MakeDate(Right(D_MONTH,4),left(D_MONTH,2)) as DATE;
LOAD DIV,
FLAG,
PARENT_GRP,
CHILD_GRP,
O_LOB,
F_LOB,
REPORT_YEAR,
REPORT_QUARTER,
D_YEAR,
D_MONTH,
AMOUNT
FROM
[https://community.qlik.com/thread/260354]
(html, codepage is 1252, embedded labels, table is @1, filters(
Remove(Row, Pos(Top, 19)),
Remove(Row, Pos(Top, 1))
Thanks,
Sri
- « Previous Replies
- Next Replies »
- Mark as New
- Bookmark
- Subscribe
- Mute
- Subscribe to RSS Feed
- Permalink
- Report Inappropriate Content
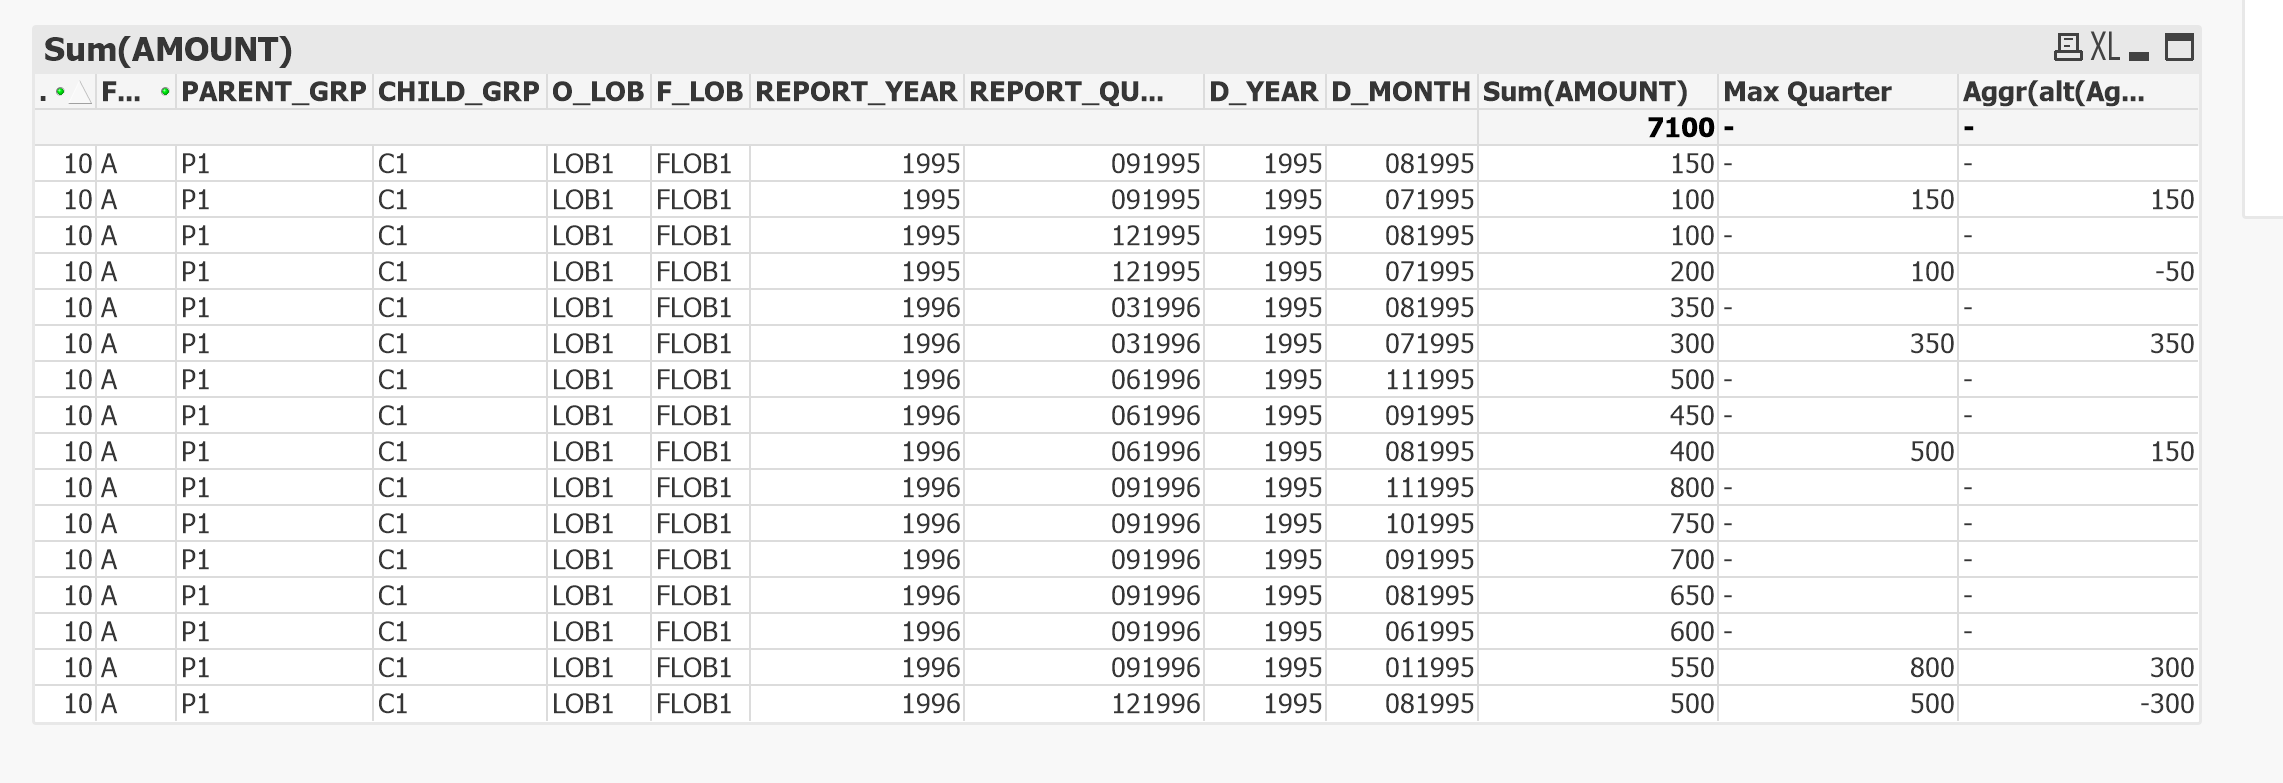
I could almost show what you want through front end solution except one value 350, don't know yet why it is showing wrong .
- Mark as New
- Bookmark
- Subscribe
- Mute
- Subscribe to RSS Feed
- Permalink
- Report Inappropriate Content
Hi Dijgvijay,
Thanks for your reply. Yes, value 350 is wrong. These values are being calculated on single year. I have to display the quarter growth comparing multiple years. Also I am looking for back end logic as the data size is in millions and using front end logic results in performance issues.
Apologies If I haven't provided my requirement clearly. I have edited my question.
My Approach: I am implementing below back end logic considering multiple dimensions. I have given list box filters for DIV, FLAG, P_GRP, C_GRP, O_LOB, F_LOB and multibox for REPORT_YEAR and REPORT_QUARTER.
I am able to get the Quarterly GROWTH for 1995 alone correctly with below approach, by framing 2 Keys ( Key with Report date and KeyWithoutReportingDate without Report date ) assigning a Flag'1' for each Min and Max report date.
TABLE1:
LOAD
*,
AutoNumber(DIV &'_'& FLAG &'_'& PARENT_GROUP &'_'& ReportingDate & '_' & CHILD_GROUP & '_' & F_LOB & '_' & O_LOB) AS Key,
AutoNumber(DIV &'_'& FLAG &'_'& PARENT_GROUP &'_'& CHILD_GROUP & '_' & F_LOB & '_' & O_LOB) AS KeyWithoutReportingDate;
LOAD
DIV,
FLAG,
PARENT_GROUP,
REPORT_YEAR,
REPORT_MONTH,
MakeDate(REPORT_YEAR, left(REPORT_MONTH,2)) AS ReportingDate,
CHILD_GROUP,
F_LOB,
O_LOB,
D_YEAR,
D_MONTH,
MakeDate(D_YEAR, left(D_MONTH,2)) AS DDate,
AMOUNT
FROM file;
LEFT JOIN(TABLE1)
LOAD
Key,
Date(Max(DDate)) AS DDate,
1 AS MaxDDate
RESIDENT TABLE1
Group By Key;
LEFT JOIN(TABLE1)
LOAD
KeyWithoutReportingDate,
Date(Max(ReportingDate)) AS ReportingDate,
1 AS MaxReportDate
RESIDENT Pivot_Temp
Group By KeyWithoutReportingDate;
LEFT JOIN(TABLE1)
LOAD
KeyWithoutReportingDate,
Date(Min(ReportingDate)) AS ReportingDate,
1 AS MinReportDate
RESIDENT TABLE1
Group By KeyWithoutReportingDate;
LEFT JOIN(TABLE1)
LOAD
KeyWithoutReportingDate,
1 AS MaxDDate,
1 AS MaxReportDate,
AMOUNT AS AMOUNT_Prior
RESIDENT TABLE1
WHERE MaxDDate = 1 AND MinReportDate = 1;
///--------------------
Data:
LOAD RowNo() AS RowNo,
KeyWithoutReportingDate,
MaxDDate,
MaxReportDate,
ReportingDate,
DDate,
Key,
DIV,
FLAG,
PARENT_GROUP,
CHILD_GROUP,
F_LOB,
O_LOB,
MinReportDate,
AMOUNT_Prior
taking 'AMOUNT - AMOUNT_Prior' expression logic as column 'Quarterly GROWTH' in table.
, but I am unable to see 'Quarterly GROWTH' if there are 4 quarters for year 1996 (Obviously bcoz I'm only extracting min and max rep dates).
I tried other ways of getting 'Growth' for all the years having more than 2 quarters data each, but in vain.
Is there any other way I can calculate GROWTH without framing Keys based on dimensions.
- Mark as New
- Bookmark
- Subscribe
- Mute
- Subscribe to RSS Feed
- Permalink
- Report Inappropriate Content
May be something like this -
Data:
LOAD DIV,
FLAG,
PARENT_GRP,
CHILD_GRP,
O_LOB,
F_LOB,
REPORT_YEAR,
REPORT_QUARTER,
AutoNumber(REPORT_QUARTER) as QuarterSeqNo,
D_YEAR,
D_MONTH,
MakeDate(Right(D_MONTH,4),left(D_MONTH,2)) as Month_Date,
AMOUNT
FROM
[https://community.qlik.com/thread/260354]
(html, codepage is 1252, embedded labels, table is @1, filters(
Remove(Row, Pos(Top, 19)),
Remove(Row, Pos(Top, 1))
))
;
MaxQuarter:
Load
DIV,
FLAG,
PARENT_GRP,
CHILD_GRP,
O_LOB,
F_LOB,
REPORT_YEAR,
REPORT_QUARTER,
QuarterSeqNo,
D_YEAR,
FirstSortedValue(AMOUNT,-D_MONTH) as MaxQAmount
Resident Data
Group By
DIV,
FLAG,
PARENT_GRP,
CHILD_GRP,
O_LOB,
F_LOB,
REPORT_YEAR,
REPORT_QUARTER,
QuarterSeqNo,
D_YEAR
Order By DIV,
FLAG,
PARENT_GRP,
CHILD_GRP,
O_LOB,
F_LOB,
REPORT_YEAR,
REPORT_QUARTER,
QuarterSeqNo,
D_YEAR
;
QuarterlyGrowth:
Load *,
if(RecNo()=1,0,Rangesum(MaxQAmount,-Peek(MaxQAmount))) as QGrowthAmount
Resident MaxQuarter;
Drop table MaxQuarter;
Drop table Data;
- Mark as New
- Bookmark
- Subscribe
- Mute
- Subscribe to RSS Feed
- Permalink
- Report Inappropriate Content
Check the QVW attached.
- Mark as New
- Bookmark
- Subscribe
- Mute
- Subscribe to RSS Feed
- Permalink
- Report Inappropriate Content
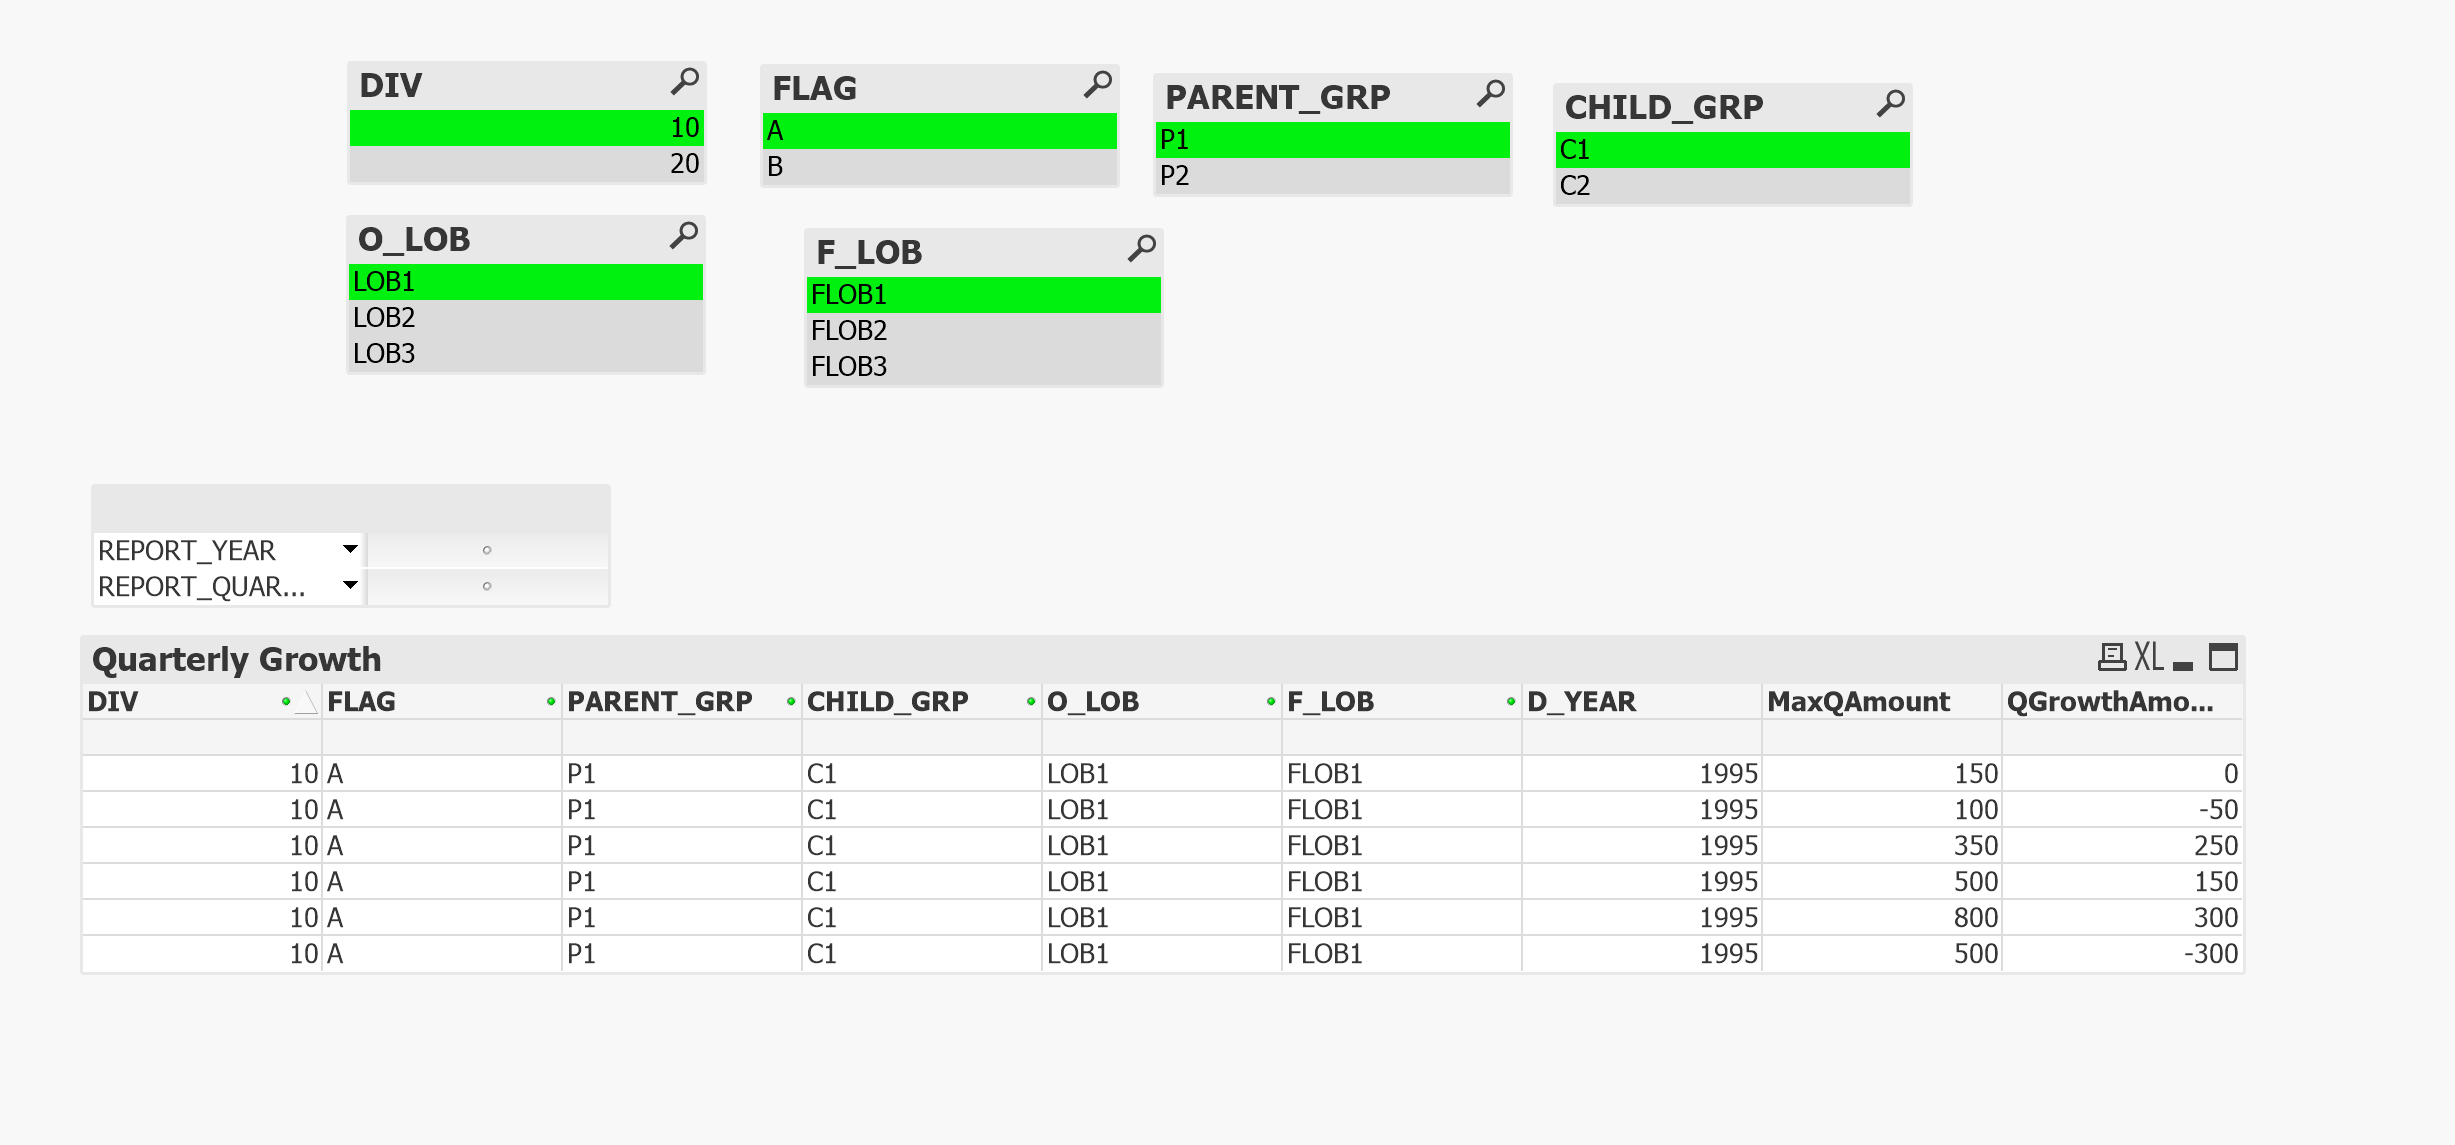
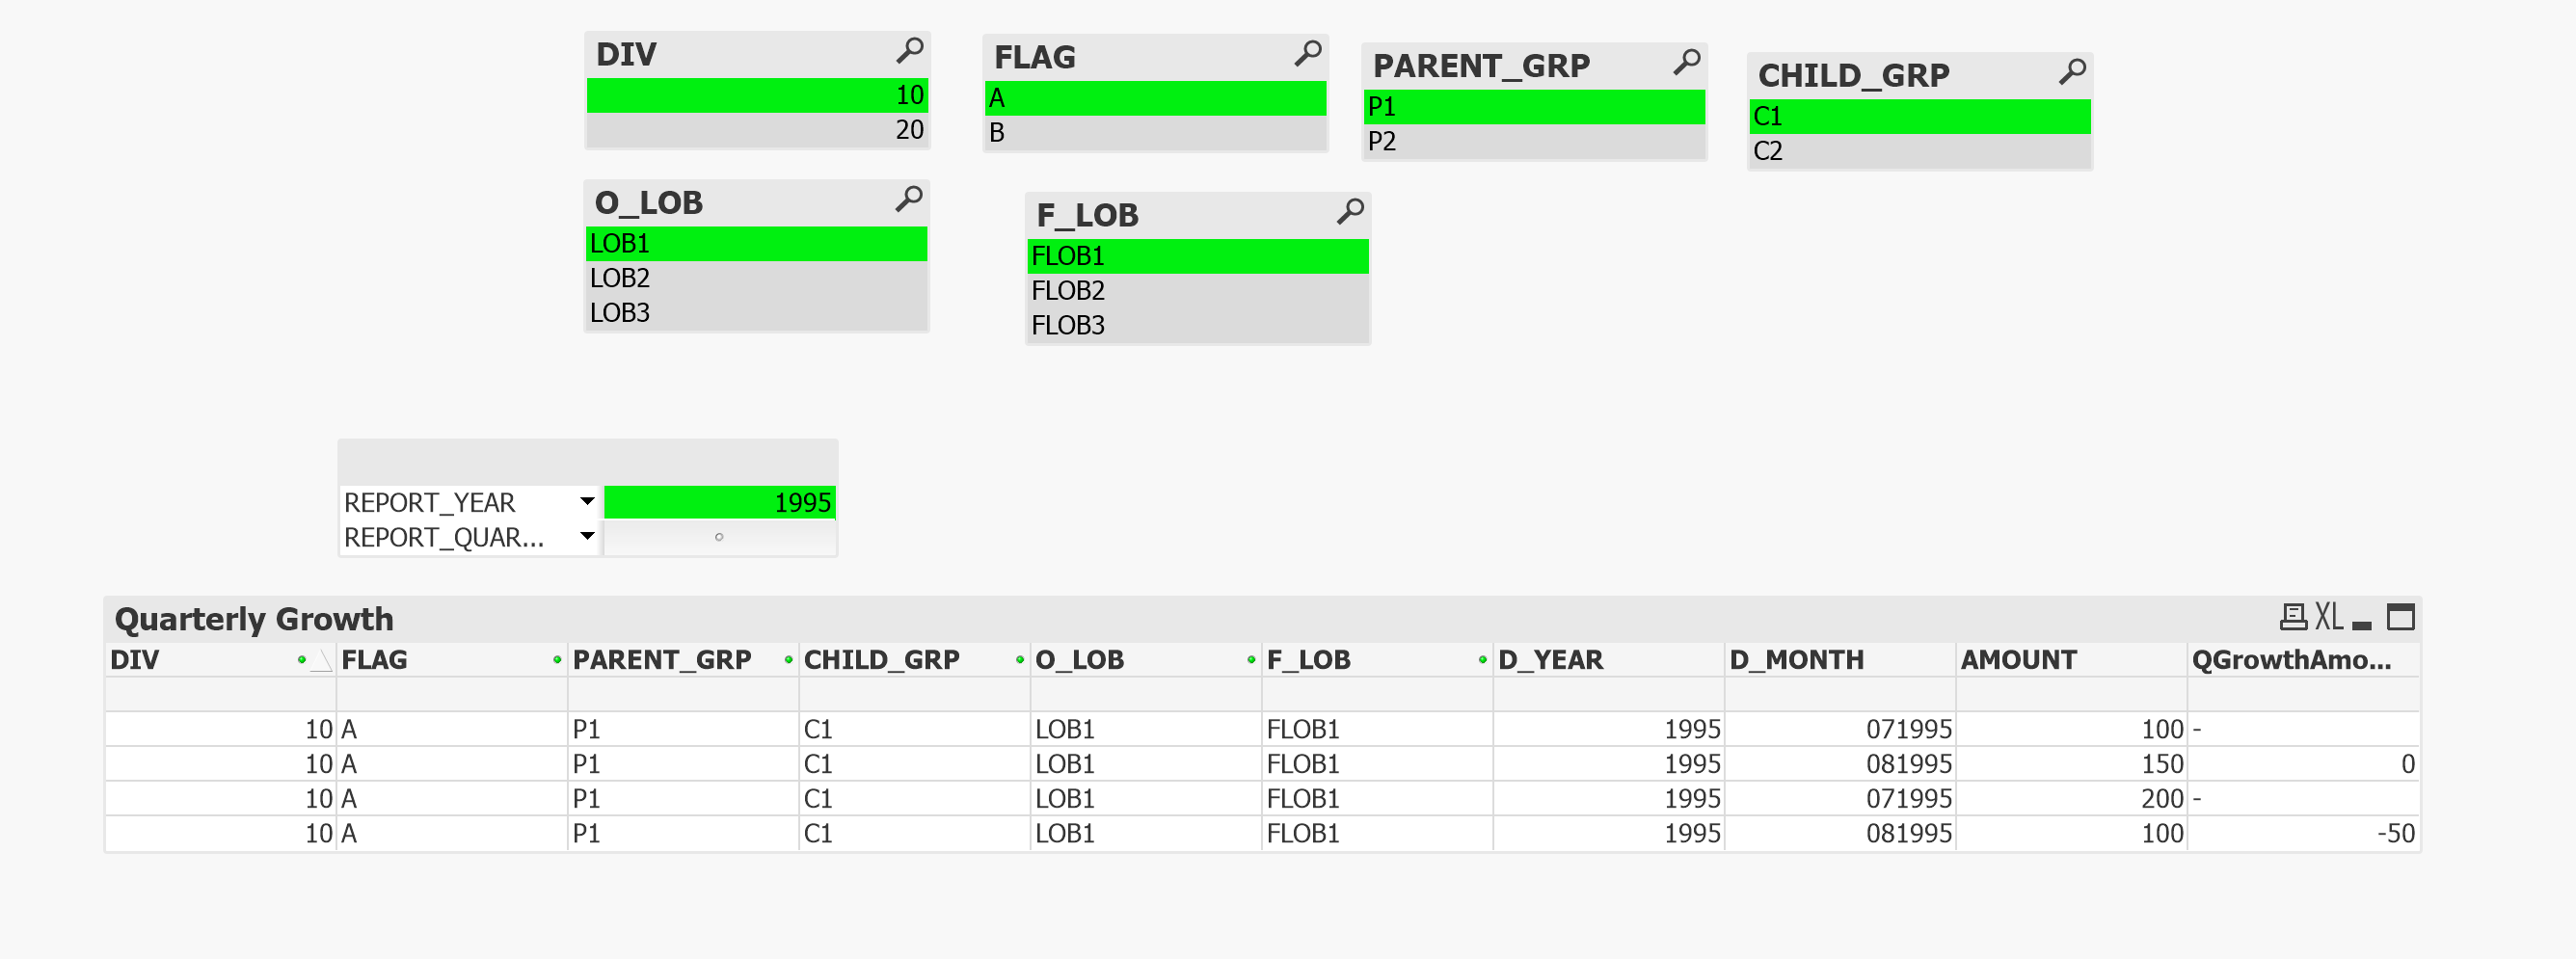
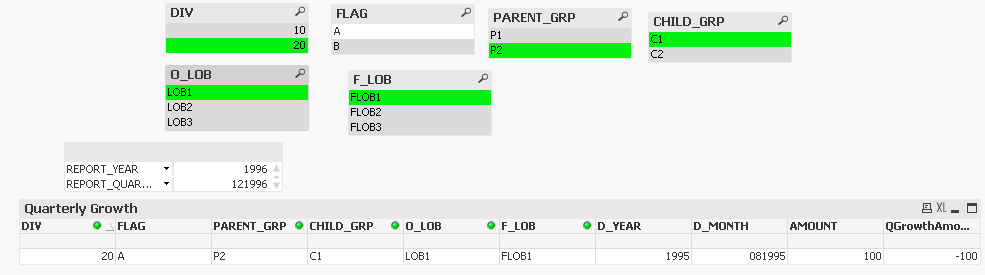
Thank you very much. This gives only the latest month rows with 'QGrowthAmount' correctly for each Report_Quarter of Report_year. However I also have to display all the rows under each report_year (This is where I am lagging)
For example if I select Rep_year - 1995, It should display as below.

If I select Rep_Year 1995, 1996. QtrGrowth should come continuously without yearly breakup.
- Mark as New
- Bookmark
- Subscribe
- Mute
- Subscribe to RSS Feed
- Permalink
- Report Inappropriate Content
I think that shouldn't be problem, we can join the final table with the first table. Here is the updated script -
//Load *,MakeDate(Right(D_MONTH,4),left(D_MONTH,2)) as Month_Date;
Data:
LOAD DIV,
FLAG,
PARENT_GRP,
CHILD_GRP,
O_LOB,
F_LOB,
REPORT_YEAR,
REPORT_QUARTER,
AutoNumber(REPORT_QUARTER) as QuarterSeqNo,
D_YEAR,
D_MONTH,
MakeDate(Right(D_MONTH,4),left(D_MONTH,2)) as Month_Date,
AMOUNT
FROM
[https://community.qlik.com/thread/260354]
(html, codepage is 1252, embedded labels, table is @1, filters(
Remove(Row, Pos(Top, 19)),
Remove(Row, Pos(Top, 1))
))
;
MaxQuarter:
Load
DIV,
FLAG,
PARENT_GRP,
CHILD_GRP,
O_LOB,
F_LOB,
REPORT_YEAR,
REPORT_QUARTER,
QuarterSeqNo,
D_YEAR,
FirstSortedValue(D_MONTH,-Month_Date) as D_MONTH,
FirstSortedValue(AMOUNT,-Month_Date) as MaxQAmount
Resident Data
Group By
DIV,
FLAG,
PARENT_GRP,
CHILD_GRP,
O_LOB,
F_LOB,
REPORT_YEAR,
REPORT_QUARTER,
QuarterSeqNo,
D_YEAR
Order By DIV,
FLAG,
PARENT_GRP,
CHILD_GRP,
O_LOB,
F_LOB,
REPORT_YEAR,
REPORT_QUARTER,
QuarterSeqNo,
D_YEAR
;
QuarterlyGrowth:
Load *,
if(RecNo()=1,0,Rangesum(MaxQAmount,-Peek(MaxQAmount))) as QGrowthAmount
Resident MaxQuarter;
join(QuarterlyGrowth)
Load *
Resident Data;
Drop table MaxQuarter;
Drop table Data;
- Mark as New
- Bookmark
- Subscribe
- Mute
- Subscribe to RSS Feed
- Permalink
- Report Inappropriate Content
Since we are doing quarter wise calculation, it won't stop at year end, will keep on calculating irrespective of year end.
- Mark as New
- Bookmark
- Subscribe
- Mute
- Subscribe to RSS Feed
- Permalink
- Report Inappropriate Content
Thanks again.
The new code changes are working perfectly as expected for Div=10.
However the QGrowthAmount should be displayed 0 for Div=20, Flag=A, P2,C1,LOB1,FLOB1 filter selections as there are no previous quarter for the same selection. Likewise for other two rows under Div=20.
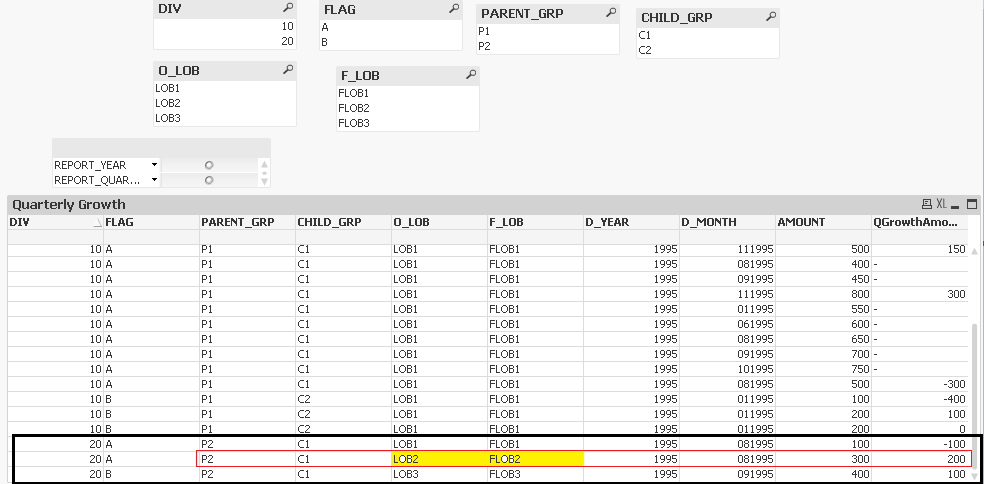
I guess we might have to change the way we handle these many dimensions in script. Any other approach ?
- Mark as New
- Bookmark
- Subscribe
- Mute
- Subscribe to RSS Feed
- Permalink
- Report Inappropriate Content
This is not big deal, our script was considering all set of record continuous with no segments based on change of dimension, you can change below condition or used exactly same to assign 0 when new dimension value is available as we process our records in sequence -
QuarterlyGrowth:
Load *,
if(DIV=Previous(DIV) and FLAG=Previous(FLAG) and PARENT_GRP = Previous(PARENT_GRP)
and CHILD_GRP = Previous(CHILD_GRP) and O_LOB=Previous(O_LOB) and F_LOB=Previous(F_LOB)
,Rangesum(MaxQAmount,-Peek(MaxQAmount)),0) as QGrowthAmount
Resident MaxQuarter;

Please mark helpful/correct the responses if you feel you could get some help out of my responses. 
- « Previous Replies
- Next Replies »