Unlock a world of possibilities! Login now and discover the exclusive benefits awaiting you.
- Qlik Community
- :
- All Forums
- :
- QlikView
- :
- Quartile
- Subscribe to RSS Feed
- Mark Topic as New
- Mark Topic as Read
- Float this Topic for Current User
- Bookmark
- Subscribe
- Mute
- Printer Friendly Page
- Mark as New
- Bookmark
- Subscribe
- Mute
- Subscribe to RSS Feed
- Permalink
- Report Inappropriate Content
Quartile
Hello,,,
I'm trying to make a Quartile productivity of employees, ordered by notes of High-Low, but it does not know how to divide this quartile in 4 equal parts.
someone could give me a hand, I'm posting an example in excel.
ps: sorry for my bad english
- Tags:
- new_to_qlikview
Accepted Solutions
- Mark as New
- Bookmark
- Subscribe
- Mute
- Subscribe to RSS Feed
- Permalink
- Report Inappropriate Content
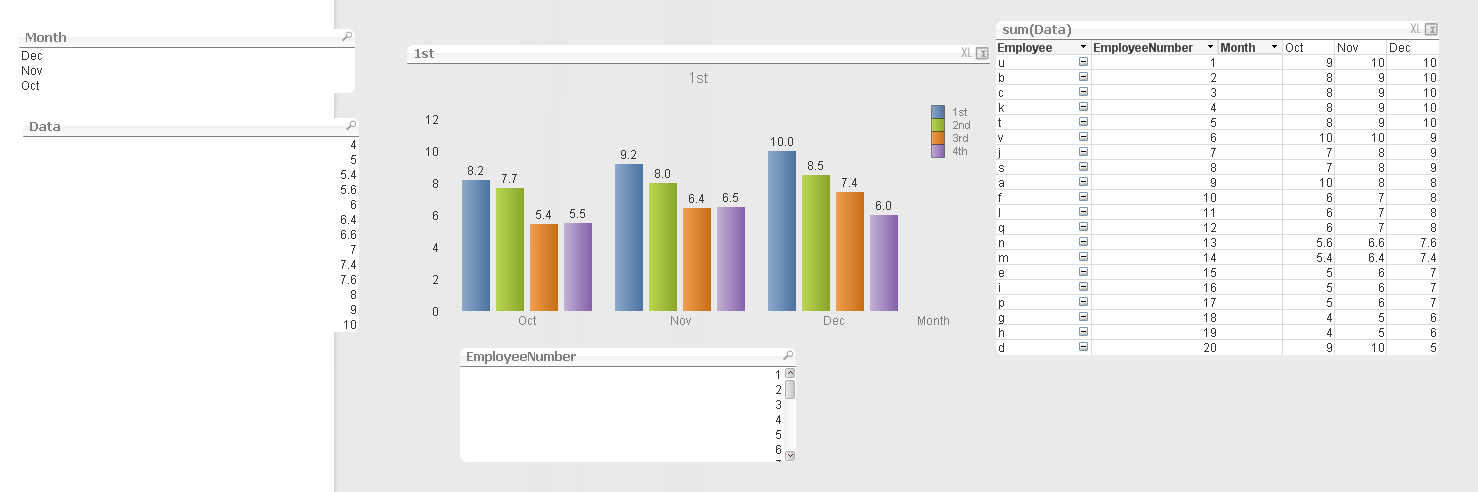
Here is an example.
I noticed that your quartile are not by the rank of the employee by the numbers, but by the row order in your spreadsheet.
So first quartile is:
avg( {<EmployeeNumber={"<=$(=count(total distinct EmployeeNumber)/4*1)"}>} Data)
2nd quartile is:
avg( {<EmployeeNumber={">$(=count(total distinct EmployeeNumber)/4*1)<=$(=count(total distinct EmployeeNumber)/4*2)"}>} Data)
3rd quartile is:
avg( {<EmployeeNumber={">$(=count(total distinct EmployeeNumber)/4*2)<=$(=count(total distinct EmployeeNumber)/4*3)"}>} Data)
4th quartile is:
avg( {<EmployeeNumber={">$(=count(total distinct EmployeeNumber)/4*3)<=$(=count(total distinct EmployeeNumber)/4*4)"}>} Data)
... BUT you may need some round() , floor() or ceil() functions to delineate the boundaries properly when number of employees is not divisible by 4.
- Mark as New
- Bookmark
- Subscribe
- Mute
- Subscribe to RSS Feed
- Permalink
- Report Inappropriate Content
What exactly is your question? Do you want to know how to calculated Quartile in QlikView?
- Mark as New
- Bookmark
- Subscribe
- Mute
- Subscribe to RSS Feed
- Permalink
- Report Inappropriate Content
Yes, it's basically dividing a column in 4 equal parts
- Mark as New
- Bookmark
- Subscribe
- Mute
- Subscribe to RSS Feed
- Permalink
- Report Inappropriate Content
Here is an example.
I noticed that your quartile are not by the rank of the employee by the numbers, but by the row order in your spreadsheet.
So first quartile is:
avg( {<EmployeeNumber={"<=$(=count(total distinct EmployeeNumber)/4*1)"}>} Data)
2nd quartile is:
avg( {<EmployeeNumber={">$(=count(total distinct EmployeeNumber)/4*1)<=$(=count(total distinct EmployeeNumber)/4*2)"}>} Data)
3rd quartile is:
avg( {<EmployeeNumber={">$(=count(total distinct EmployeeNumber)/4*2)<=$(=count(total distinct EmployeeNumber)/4*3)"}>} Data)
4th quartile is:
avg( {<EmployeeNumber={">$(=count(total distinct EmployeeNumber)/4*3)<=$(=count(total distinct EmployeeNumber)/4*4)"}>} Data)
... BUT you may need some round() , floor() or ceil() functions to delineate the boundaries properly when number of employees is not divisible by 4.
- Mark as New
- Bookmark
- Subscribe
- Mute
- Subscribe to RSS Feed
- Permalink
- Report Inappropriate Content
I think that Fractile() is the function you need, using 0.25, 0.5 and 0.75 as parameters
Please check your manual for proper usage
- Mark as New
- Bookmark
- Subscribe
- Mute
- Subscribe to RSS Feed
- Permalink
- Report Inappropriate Content
thanks jonathan poole, i will test with round()
- Mark as New
- Bookmark
- Subscribe
- Mute
- Subscribe to RSS Feed
- Permalink
- Report Inappropriate Content
I've tested it with fractile, but are of different sizes quartiles