Unlock a world of possibilities! Login now and discover the exclusive benefits awaiting you.
- Qlik Community
- :
- All Forums
- :
- QlikView App Dev
- :
- Question Using AGGR() in Set Analysis Search
- Subscribe to RSS Feed
- Mark Topic as New
- Mark Topic as Read
- Float this Topic for Current User
- Bookmark
- Subscribe
- Mute
- Printer Friendly Page
- Mark as New
- Bookmark
- Subscribe
- Mute
- Subscribe to RSS Feed
- Permalink
- Report Inappropriate Content
Question Using AGGR() in Set Analysis Search
I have a table that stores patient vital information. In that table, there is a "BMI Class" column that shows the class with possible values of Healthy, Overweight, and Underweight and a "Vitals Rank" column that tells me for each patient, which is the latest vital. Rank 1 is the most recent, Rank 2 is the 2nd most recent. When collecting vitals for a patient, they may not enter the required information to calculate BMI, so sometimes the BMI Class field will be null.
I'm trying to create a bar chart that shows the count of patient in each BMI class. To do this, I need to find the most recent (based on lowest rank) non-null entry in the BMI Class Field for each patient. In my bar chart, my dimension is [Vital Signs.BMI Class] and my expression is this:
count(distinct
{<
[Vital Signs.Vital Batch ID] =
{"=AGGR(
If( [Vital Signs.Vitals Rank] =
Min(
{<[Vital Signs.BMI Class]={'Healthy', 'Underweight', 'Overweight'}>}
TOTAL <[Client ID]> [Vital Signs.Vitals Rank]
),
[Vital Signs.Vital Batch ID]
),
[Client ID], [Vital Signs.Vital Batch ID])"}
>}
[Client ID])
Here's a sample of what data in my Vitals table may look like. Based on this data, i'd expect to see a count of 2 clients in the Healthy category ([ClientID] 1 & 3) and one count in the Overweight category ([ClientID] 2). I never get any data to return in the chart, so i think there is something wrong with my subquery/search set analysis.
| Client ID | Vital Signs.Vital Batch ID | Vital Signs.BMI Class | Vital Signs.Vitals Rank |
|---|---|---|---|
| 1 | 1234 | - | 1 |
| 1 | 1235 | Healthy | 2 |
| 1 | 1236 | - | 3 |
| 1 | 1237 | Overweight | 4 |
| 1 | 1238 | - | 5 |
| 1 | 1239 | Underweight | 6 |
| 2 | 1240 | Overweight | 1 |
| 2 | 1241 | - | 2 |
| 2 | 1242 | Healthy | 3 |
| 3 | 1243 | - | 1 |
| 3 | 1244 | - | 2 |
| 3 | 1245 | - | 3 |
| 3 | 1246 | Healthy | 4 |
| 3 | 1247 | Overweight | 5 |
| 3 | 1248 | - | 6 |
Any help would be very much appreciated! Thanks!
- Tags:
- set analysis*
- Mark as New
- Bookmark
- Subscribe
- Mute
- Subscribe to RSS Feed
- Permalink
- Report Inappropriate Content
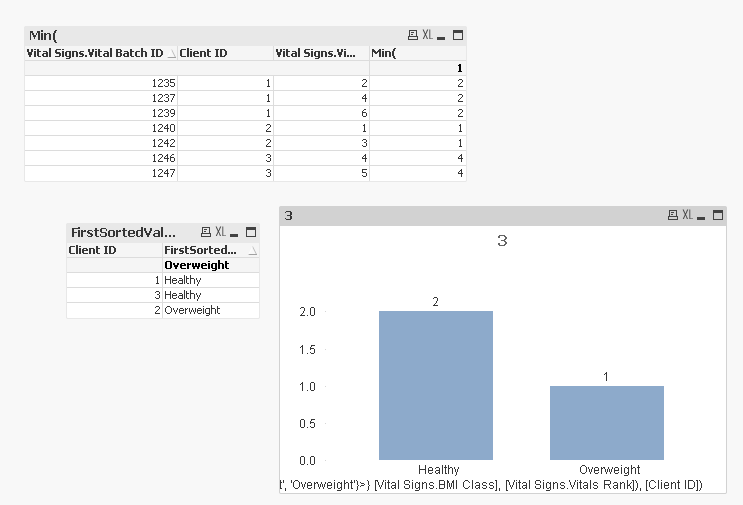
Try a slightly different approach
Dimension
=Aggr(FirstSortedValue({<[Vital Signs.BMI Class]={'Healthy', 'Underweight', 'Overweight'}>} [Vital Signs.BMI Class], [Vital Signs.Vitals Rank]), [Client ID])
Expression
=Count(DISTINCT [Client ID])
- Mark as New
- Bookmark
- Subscribe
- Mute
- Subscribe to RSS Feed
- Permalink
- Report Inappropriate Content
Here is the expression which seems to work with set analysis search string
=Count(DISTINCT {<[Vital Signs.Vital Batch ID] = {"=[Vital Signs.Vitals Rank] = Aggr(Min(TOTAL <[Client ID]>{<[Vital Signs.BMI Class]={'Healthy', 'Underweight', 'Overweight'}>} [Vital Signs.Vitals Rank]), [Client ID], [Vital Signs.Vitals Rank])"}>} [Client ID])
- Mark as New
- Bookmark
- Subscribe
- Mute
- Subscribe to RSS Feed
- Permalink
- Report Inappropriate Content
Yes, this works perfectly, thank you so much!