Unlock a world of possibilities! Login now and discover the exclusive benefits awaiting you.
- Qlik Community
- :
- All Forums
- :
- QlikView App Dev
- :
- Radar Chart
- Subscribe to RSS Feed
- Mark Topic as New
- Mark Topic as Read
- Float this Topic for Current User
- Bookmark
- Subscribe
- Mute
- Printer Friendly Page
- Mark as New
- Bookmark
- Subscribe
- Mute
- Subscribe to RSS Feed
- Permalink
- Report Inappropriate Content
Radar Chart
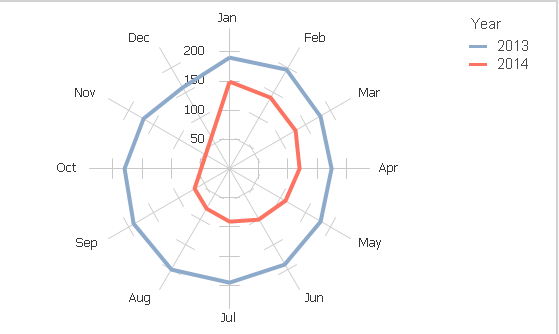
I have data for the time periods Jan 2013 through Sep 2014, plotted in the Radar chart shown below.
I would like to show a continuous line starting in Jan 2013 and ending in Sep 2014.
i.e, Dec 2013 will be joined to Jan 2014 and Sep 2014 will not be joined to Jan 2014.
I would very much appreciate your help in doing this.
- Tags:
- chart
Accepted Solutions
- Mark as New
- Bookmark
- Subscribe
- Mute
- Subscribe to RSS Feed
- Permalink
- Report Inappropriate Content
Hi,
I think it is not possible with the existing Radar chart, may be check for any extension available.
Regards,
jagan.
- Mark as New
- Bookmark
- Subscribe
- Mute
- Subscribe to RSS Feed
- Permalink
- Report Inappropriate Content
Hi,
Create a new dimension for MonthYear like below
LOAD
*,
MonthName(DateFieldName) AS MonthYear
FROM DataSource;
Now use MonthYear as dimension in the chart.
Hope this is what you are expecting.
Regards,
Jagan.
- Mark as New
- Bookmark
- Subscribe
- Mute
- Subscribe to RSS Feed
- Permalink
- Report Inappropriate Content
Hi Jagan,
No doubt, this gives me a continuous line, but not a spiral line, similar to the one below, but with month (jan, feb,..) as dimension.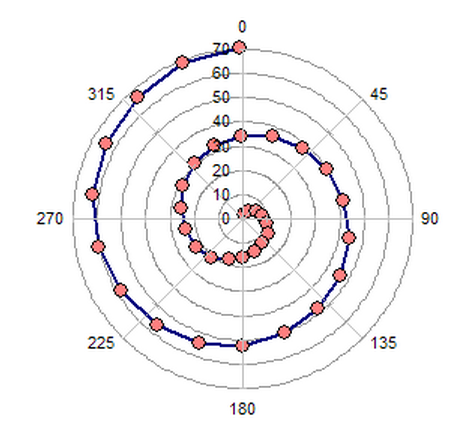
- Mark as New
- Bookmark
- Subscribe
- Mute
- Subscribe to RSS Feed
- Permalink
- Report Inappropriate Content
Hi,
I think it is not possible with the existing Radar chart, may be check for any extension available.
Regards,
jagan.