Unlock a world of possibilities! Login now and discover the exclusive benefits awaiting you.
- Qlik Community
- :
- All Forums
- :
- QlikView App Dev
- :
- Rank Top 3 Results by individual dimensions
- Subscribe to RSS Feed
- Mark Topic as New
- Mark Topic as Read
- Float this Topic for Current User
- Bookmark
- Subscribe
- Mute
- Printer Friendly Page
- Mark as New
- Bookmark
- Subscribe
- Mute
- Subscribe to RSS Feed
- Permalink
- Report Inappropriate Content
Rank Top 3 Results by individual dimensions
Hello, I'm struggling with the last part of this chart.
I have created a chart listing out the barriers (Chart A) and the amount of lost time to each. The coloured bars represent the 4 workmodes.
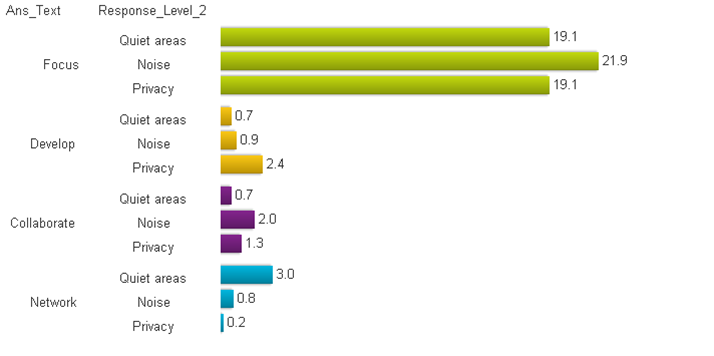
I now trying to create Chart B that takes the 4 workmodes and present the top 3 barriers for each workmode. However the top 3 barriers over all are represented instead!
I can't get the chart todisplay the top 3 barriers for each workmode - I don't think I'm far off!
I have attached the qvw for you.
Appreciate any help.
Thanks
Rob
Chart A
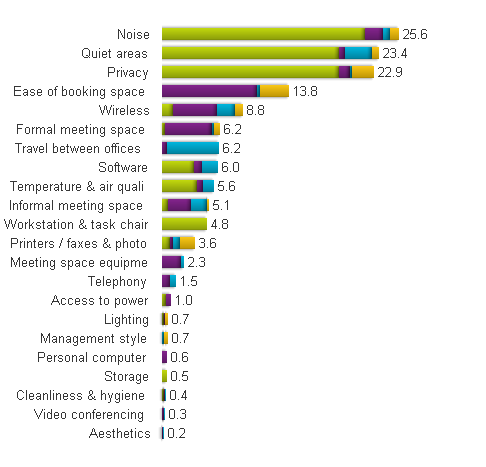
Chart B
- Mark as New
- Bookmark
- Subscribe
- Mute
- Subscribe to RSS Feed
- Permalink
- Report Inappropriate Content
HI,
Please find attached file for solution, I flushed all the data you can see the values after reloading.
Regards,
Jagan.
- Mark as New
- Bookmark
- Subscribe
- Mute
- Subscribe to RSS Feed
- Permalink
- Report Inappropriate Content
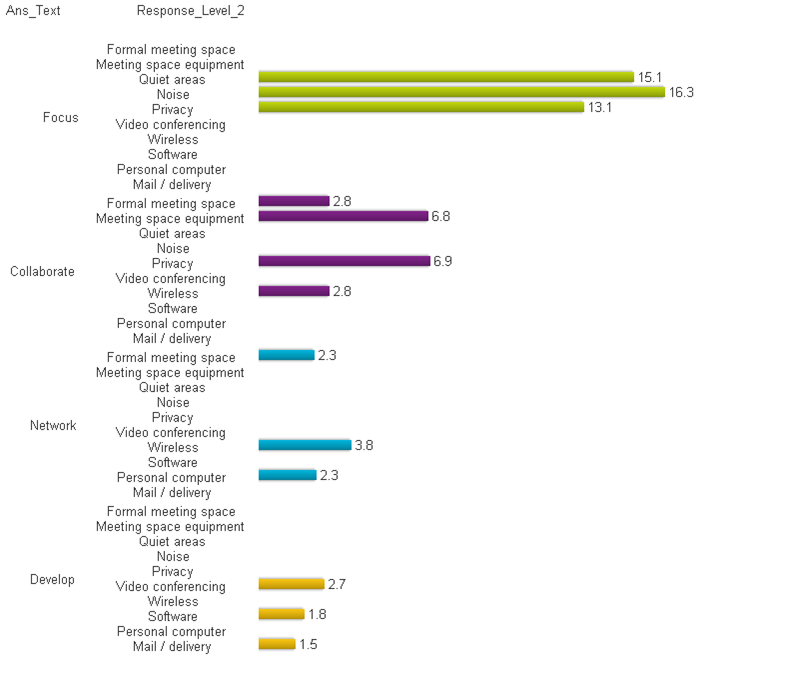
Hi Jagan, it now provides the top 3 for each of the workmodes - thanks for that.
I now have the remaining lower ranked items in the chart, so could I get your help again!
1. can we remove the empty items
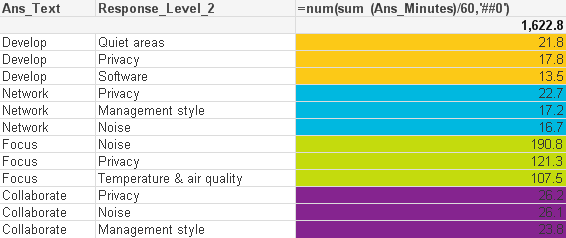
2. is it possible to have the 3 results in each workmode ranked highest to lowest.
This is were the chart is at the moment.
I've added the qvw.
Thanks again for your help.
Rob
- Mark as New
- Bookmark
- Subscribe
- Mute
- Subscribe to RSS Feed
- Permalink
- Report Inappropriate Content
Happy New Year to everyone.
If anyone has a solution for the above it would be appreciated.
Thanks
Rob
- Mark as New
- Bookmark
- Subscribe
- Mute
- Subscribe to RSS Feed
- Permalink
- Report Inappropriate Content
Very strange this - I can create the information in a table but it will not translate to a chart.
What's going on Qlikview ???
- Mark as New
- Bookmark
- Subscribe
- Mute
- Subscribe to RSS Feed
- Permalink
- Report Inappropriate Content
Please find the link below to the correct answer.
I hope it helps others that have struggled with this.
Thanks goes to Gysbert Wassenaar.