Unlock a world of possibilities! Login now and discover the exclusive benefits awaiting you.
- Qlik Community
- :
- All Forums
- :
- QlikView App Dev
- :
- Rank issue?
- Subscribe to RSS Feed
- Mark Topic as New
- Mark Topic as Read
- Float this Topic for Current User
- Bookmark
- Subscribe
- Mute
- Printer Friendly Page
- Mark as New
- Bookmark
- Subscribe
- Mute
- Subscribe to RSS Feed
- Permalink
- Report Inappropriate Content
Rank issue?
Hi All,
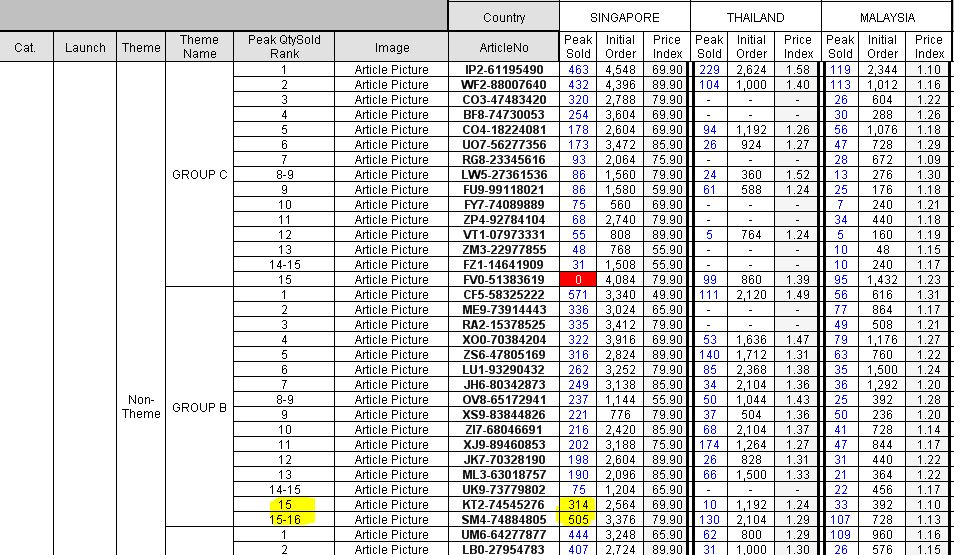
Kindly refer to the below screen shot, I've tried to created Calculated dimension as "Peak Sold Qty rank" and it's based Singapore Peak Sold Qty, it's working fine most the case and only few case like below screen shot highlighted in yellow the rank value not correct. can you advise me how to resolve this issue? thanks
Requirement: Report display based on Singapore Peak Sold (high to low Qty i.e descending order)
Note: ranking group based on Launch, Theme,Theme Name
Cal.dimension:
Peak SoldQty Rank
=aggr(Rank(Sum(Aggr(max({<Year={"*"},Week= {"*"},Country={'SINGAPORE'},ArticleNo>}
aggr(sum({<Year={"*"},Week= {"*"},Country={'SINGAPORE'},ArticleNo>}SoldQty),Year,Week,ArticleNo)),ArticleNo)),4)
,MaterialHuddleGrpDesc,Launch_No,ThemeGroup,ThemeName,ArticleNo)
Measure:
Peak Sold
if(Dimensionality() = 5, Max({<Year={"*"},Week= {"*"},ArticleNo>}Aggr(sum({<Year,Week,ArticleNo>}SoldQty),ArticleNo, Week,Year)),
max({<Year={"*"},Week= {"*"},ArticleNo>}
aggr(sum({<Year={"*"},Week= {"*"},ArticleNo>}SoldQty),Year,Week,Country,ArticleNo)))
Thanks,
Deva