Unlock a world of possibilities! Login now and discover the exclusive benefits awaiting you.
- Qlik Community
- :
- All Forums
- :
- QlikView App Dev
- :
- Rank() within a specific dimension when you have m...
- Subscribe to RSS Feed
- Mark Topic as New
- Mark Topic as Read
- Float this Topic for Current User
- Bookmark
- Subscribe
- Mute
- Printer Friendly Page
- Mark as New
- Bookmark
- Subscribe
- Mute
- Subscribe to RSS Feed
- Permalink
- Report Inappropriate Content
Rank() within a specific dimension when you have multiple ones
Hi,
I am new to Qlik and trying to solve the following issue.
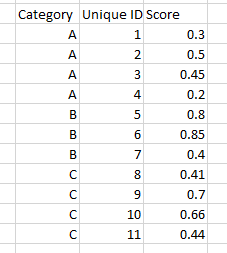
I have a table with two dimensions, one with the entry's unique ID, and one with a category, as in the example below.

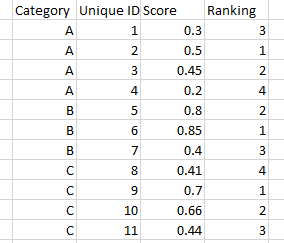
My goal is to create a new column with a ranking of 'Score' - my measure - per category:

If I use the expression
Rank(Score)
I get a column of ones, as the command takes the most granular dimension (Unique ID) as the default one. If I use
Rank(TOTAL Score)
It obviously returns a ranking regardless of all the dimensions. By reading the documentation and similar questions asked by other users I reckon that it should be possible to specify which dimension to use for TOTAL, with the following syntax:
Rank(TOTAL <Category> Score)
Yet, the formula returns an error and only null column values. I've tried different syntax, use of brackets but I still cannot grasp what I am doing wrong.
Please note that I cannot create the ranking column when loading the data.
I would immensely appreciate if someone were so kind to help on this!
Accepted Solutions
- Mark as New
- Bookmark
- Subscribe
- Mute
- Subscribe to RSS Feed
- Permalink
- Report Inappropriate Content
After some additional playing around more with the Aggr function, I found the solution:
=aggr(rank(sum(Score)), Category, UniqueID)
Thank you again Sunny, without your lead I would have not solved it.
- Mark as New
- Bookmark
- Subscribe
- Mute
- Subscribe to RSS Feed
- Permalink
- Report Inappropriate Content
Try this:
Aggr(Rank(Score), [Unique ID], Category)
- Mark as New
- Bookmark
- Subscribe
- Mute
- Subscribe to RSS Feed
- Permalink
- Report Inappropriate Content
My bad, the expression should be this:
Aggr(Rank(Score),Category, [Unique ID])
- Mark as New
- Bookmark
- Subscribe
- Mute
- Subscribe to RSS Feed
- Permalink
- Report Inappropriate Content
After some additional playing around more with the Aggr function, I found the solution:
=aggr(rank(sum(Score)), Category, UniqueID)
Thank you again Sunny, without your lead I would have not solved it.
- Mark as New
- Bookmark
- Subscribe
- Mute
- Subscribe to RSS Feed
- Permalink
- Report Inappropriate Content
Awesome ![]()
I am glad you found what you were looking for. Please close this thread by marking correct and helpful responses.
Qlik Community Tip: Marking Replies as Correct or Helpful
Best,
Sunny
- Mark as New
- Bookmark
- Subscribe
- Mute
- Subscribe to RSS Feed
- Permalink
- Report Inappropriate Content
Hi, I have similar type of problem, and to my understanding this function might solve that also.
I have buttons where user can choose the dimension and measure on the graphs. On this one graph, I have also time (months) as an dimension, in addition to what user chooses. My problem is that some of these dimensions have too many unique values, so the line graph gets extremely messy. I would like to show for example top 5 for whatever the user chooses for the dimension. The problem is that the top 5 is not calculated on the measure of that graph but, another measure.
My dimension has the following syntax: pick($(VTable),Dim1,Dim2,Dim3)
and the measure of the graph:
if(VVolumeDummy = 1, sum({<DEAL={'Won'}>} Turnover) / sum({<DEAL={'Won','Lost'}>} Turnover),
count({<DEAL={'Won'}>} ID) / count({<DEAL={'Won','Lost'}>} ID)
and the measure by which I would like to show the top 5:
if(VVolumeDummy = 1, sum({<DEAL={'Won'}>} Turnover),count({<DEAL={'Won'}>} ID)
Is it possible to do a calculated dimension somehow with that similar kind of syntax/logic?
Br
Matti
- Mark as New
- Bookmark
- Subscribe
- Mute
- Subscribe to RSS Feed
- Permalink
- Report Inappropriate Content
It might be easier if you are able to share a sample and let us know the expected output