Unlock a world of possibilities! Login now and discover the exclusive benefits awaiting you.
- Qlik Community
- :
- All Forums
- :
- QlikView App Dev
- :
- Ranking in Pivot table showing only TOP x Job Code...
- Subscribe to RSS Feed
- Mark Topic as New
- Mark Topic as Read
- Float this Topic for Current User
- Bookmark
- Subscribe
- Mute
- Printer Friendly Page
- Mark as New
- Bookmark
- Subscribe
- Mute
- Subscribe to RSS Feed
- Permalink
- Report Inappropriate Content
Ranking in Pivot table showing only TOP x Job Codes
Hi all,
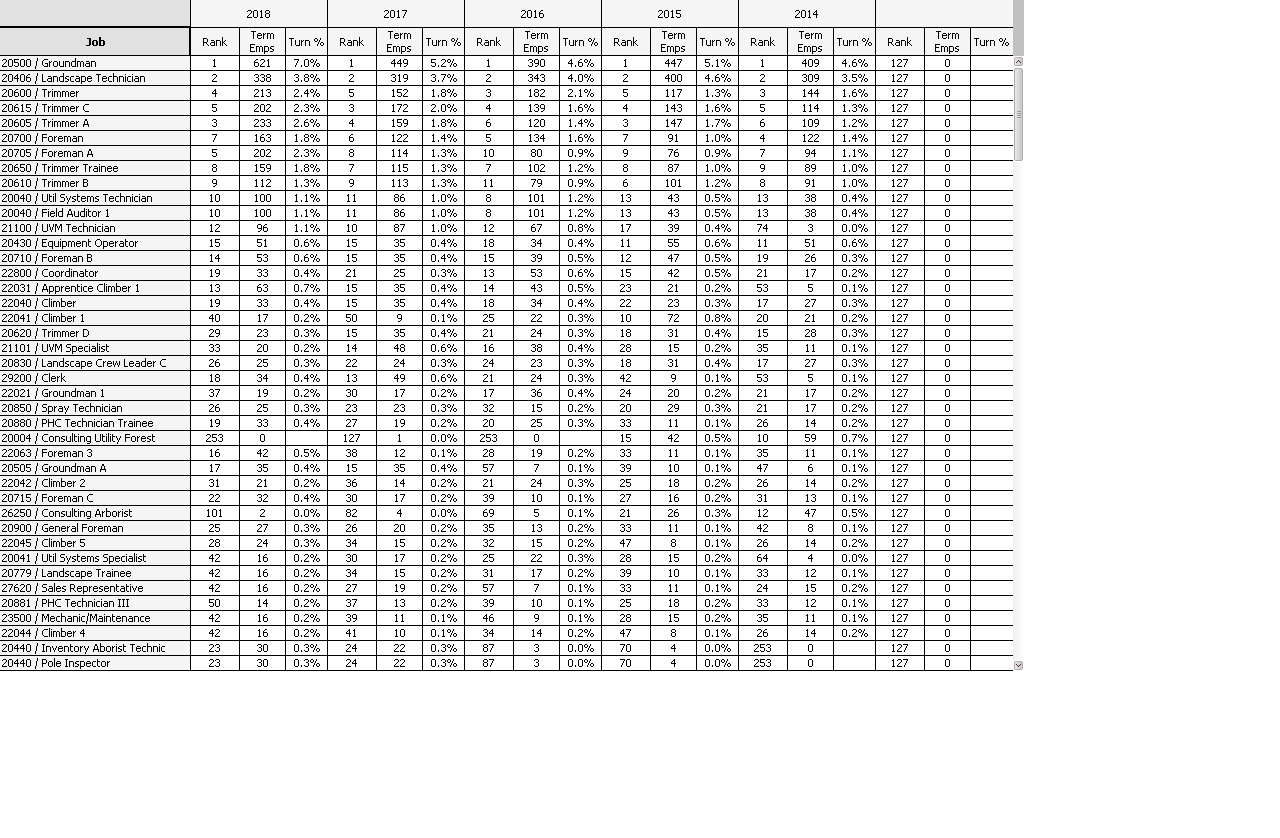
I am trying to show the top 5 or 10 job codes across 5 years. Sort of having a problem getting it to work. Any ideas? For example I need to show the Top 5 Job Codes for each year. Here is my Rank statement: Rank(count({<InActive = {1},YTDFlag = {1}>} DISTINCT([Employee Number])))
And I sort based on Job with this : descending on this count({<InActive = {1},YTDFlag = {1}>} DISTINCT([Employee Number]))
Thanks

- Tags:
- top 5
Accepted Solutions
- Mark as New
- Bookmark
- Subscribe
- Mute
- Subscribe to RSS Feed
- Permalink
- Report Inappropriate Content
would you be able to attach a sample with the original file structure ? because with a pivot structure I'll need to do a crosstable and I'm not sure I will get your original structure
- Mark as New
- Bookmark
- Subscribe
- Mute
- Subscribe to RSS Feed
- Permalink
- Report Inappropriate Content
Hi,
so what is the expected output here ? would you be able to surround the lines using the image above ?
- Mark as New
- Bookmark
- Subscribe
- Mute
- Subscribe to RSS Feed
- Permalink
- Report Inappropriate Content
I would like to see the Top 5 jobs for each year based on Term Emps. Ignore the rank for right now.
- Mark as New
- Bookmark
- Subscribe
- Mute
- Subscribe to RSS Feed
- Permalink
- Report Inappropriate Content
ok, just share your data structure and I'll try to populate a table with the same structure and share a QVW
- Mark as New
- Bookmark
- Subscribe
- Mute
- Subscribe to RSS Feed
- Permalink
- Report Inappropriate Content
Forgot to add the spreadsheet thanks
- Mark as New
- Bookmark
- Subscribe
- Mute
- Subscribe to RSS Feed
- Permalink
- Report Inappropriate Content
is that your original file or it is an extraction from a pivot table ?
if you want to load that file, you will need to make a crosstable on the script
- Mark as New
- Bookmark
- Subscribe
- Mute
- Subscribe to RSS Feed
- Permalink
- Report Inappropriate Content
That's a dump from the already created pivot table.
- Mark as New
- Bookmark
- Subscribe
- Mute
- Subscribe to RSS Feed
- Permalink
- Report Inappropriate Content
would you be able to attach a sample with the original file structure ? because with a pivot structure I'll need to do a crosstable and I'm not sure I will get your original structure
- Mark as New
- Bookmark
- Subscribe
- Mute
- Subscribe to RSS Feed
- Permalink
- Report Inappropriate Content
Youssef,
Thanks for your help. My user called yesterday afternoon and wanted to go a different route other than Top 5 by year. Go figure.