Unlock a world of possibilities! Login now and discover the exclusive benefits awaiting you.
- Qlik Community
- :
- All Forums
- :
- QlikView App Dev
- :
- Reduce a chart value to base 100 ..%
- Subscribe to RSS Feed
- Mark Topic as New
- Mark Topic as Read
- Float this Topic for Current User
- Bookmark
- Subscribe
- Mute
- Printer Friendly Page
- Mark as New
- Bookmark
- Subscribe
- Mute
- Subscribe to RSS Feed
- Permalink
- Report Inappropriate Content
Reduce a chart value to base 100 ..%
Hi all,
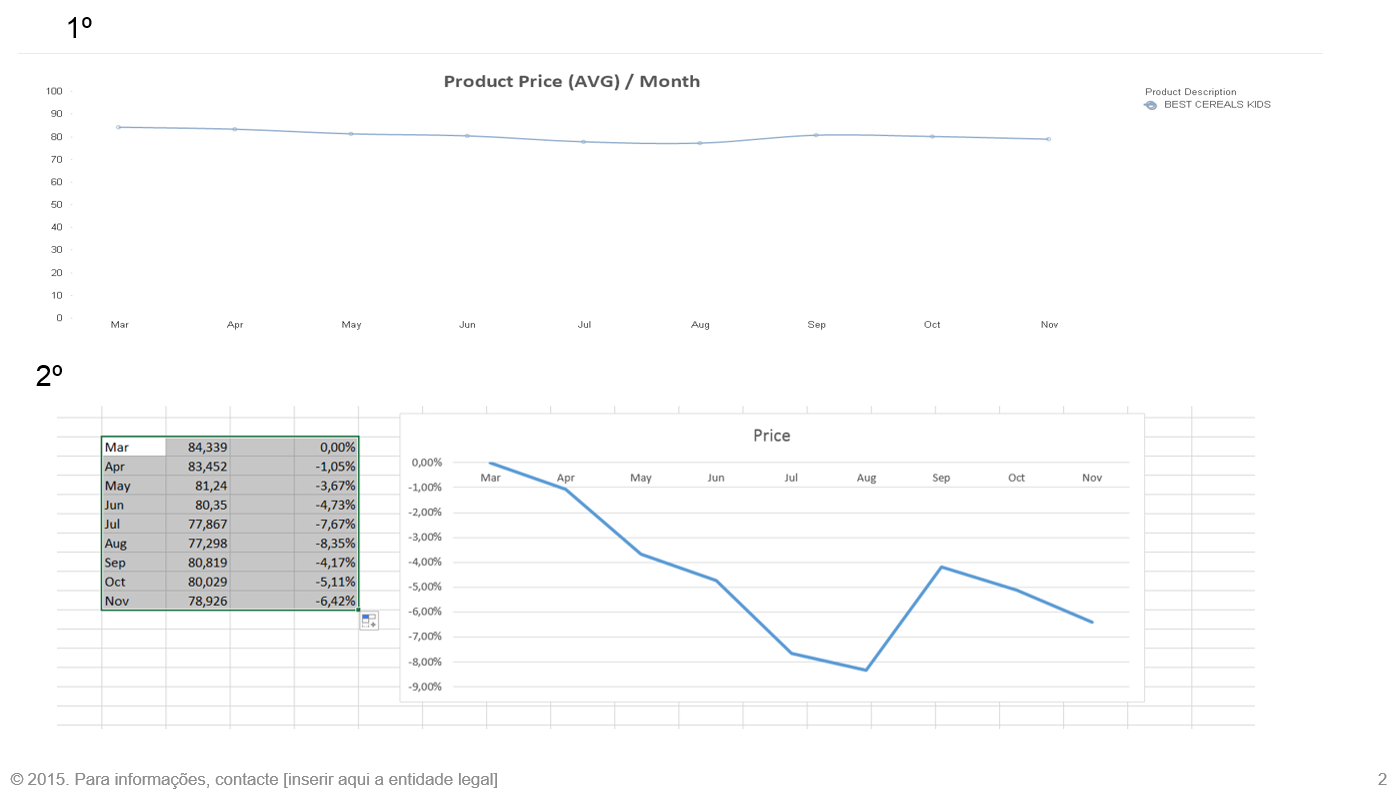
I need help to create a chart to compare the growth and decrease in % from the price value.
See the picture...
I have the first chart but i want the second chart...
Mar = 0;
Comprare:
Apr with Mar;
May with Mar;
Jun wuth Mar;
.
.
.
Can u help me?
Tanks.
Regards,
PL
- Mark as New
- Bookmark
- Subscribe
- Mute
- Subscribe to RSS Feed
- Permalink
- Report Inappropriate Content
So you need the bottom chart in QV?
Could you post your app?
- Mark as New
- Bookmark
- Subscribe
- Mute
- Subscribe to RSS Feed
- Permalink
- Report Inappropriate Content
Hi Robert,
I don't understand what you mean with 'bottom chart'.
I don't need the chart with the absolute value Price. I need the comparison (%) the prices of months with the first month 'Mar'.
Let me explain:
In 'Mar' i have 0%
In 'Feb' the price growth 1,5% (comparison of 'Mar')
In 'Apr' the price growth 0,75% (comparison of 'Mar')
...
In excel the calculation is:
For Mar ---- (Mar-Mar)/Mar) = 0%
For Feb ---- (Feb-Mar/Mar) = +/-X%
Variation% = (Vn-V0)/V0
...
I fix the value price for Mar, because is comparative value.
Thank in advance.
Regards,
Pedro Lopes