Unlock a world of possibilities! Login now and discover the exclusive benefits awaiting you.
- Qlik Community
- :
- All Forums
- :
- QlikView App Dev
- :
- Reference line in the chart
- Subscribe to RSS Feed
- Mark Topic as New
- Mark Topic as Read
- Float this Topic for Current User
- Bookmark
- Subscribe
- Mute
- Printer Friendly Page
- Mark as New
- Bookmark
- Subscribe
- Mute
- Subscribe to RSS Feed
- Permalink
- Report Inappropriate Content
Reference line in the chart
Hi All,
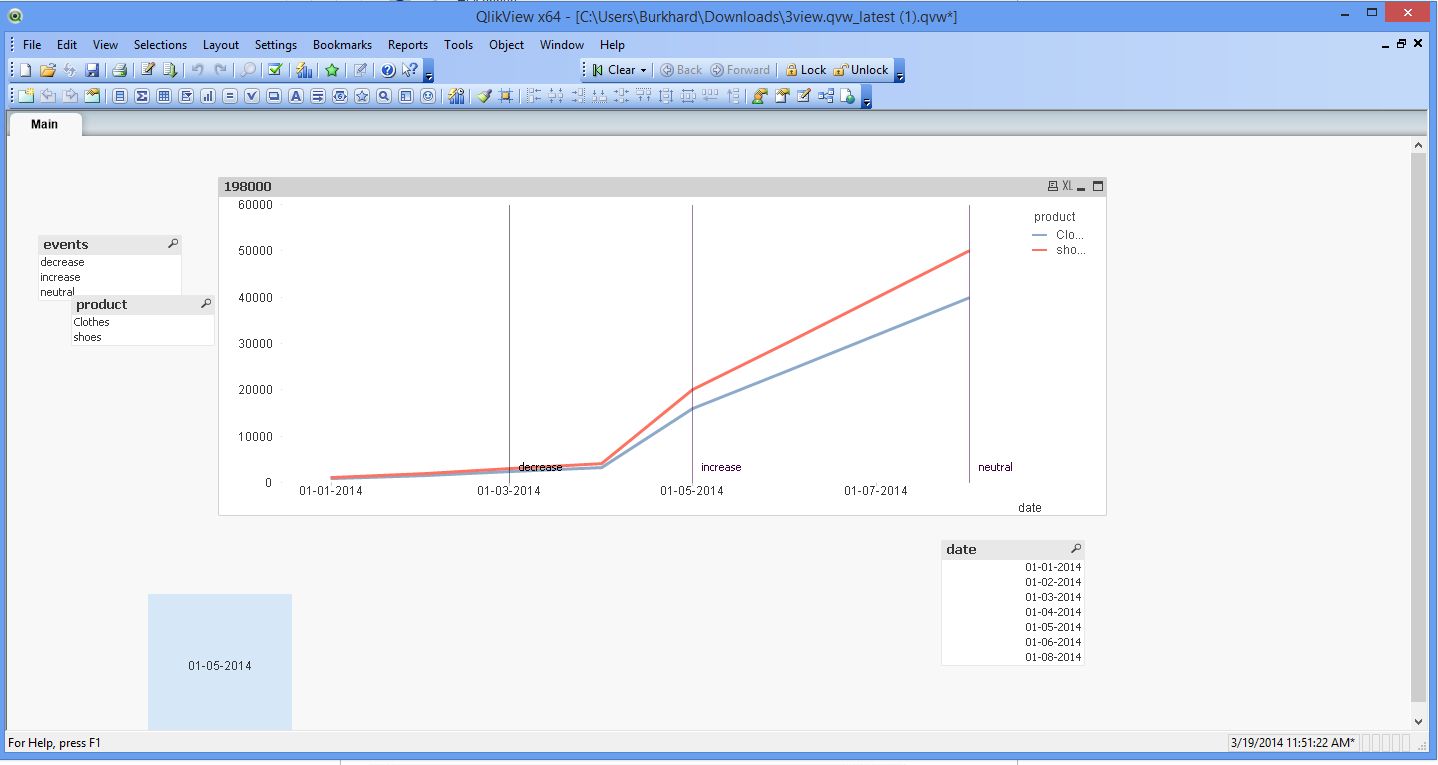
I want to show a reference line vertically in the chart when an event occurs in the particular month. PFA
- Mark as New
- Bookmark
- Subscribe
- Mute
- Subscribe to RSS Feed
- Permalink
- Report Inappropriate Content
HI Burkhard,
Thanks for your response,but what i am trying to ask is in my date dimension i don't have
15-01-2014,
15-02-2014,....... why these are showing,any ideas???
- Mark as New
- Bookmark
- Subscribe
- Mute
- Subscribe to RSS Feed
- Permalink
- Report Inappropriate Content
Hi Kannuri,
we probably have different country settings, so there is a misunderstanding of the systems.
You have to look if the date format you enter into the reference line expression is the same as on your x axis in the chart. You can test this by copying it into a text box and see what is displayed there...
Hope this helps
Burkhard
- Mark as New
- Bookmark
- Subscribe
- Mute
- Subscribe to RSS Feed
- Permalink
- Report Inappropriate Content
Hi Burkhard,
See the attached, Here i have date fields,01-01-2014,01-02-2014,01-03-2014........01-08-2014
but in chart it is not displaying 01-02-2014,01-04-2014,01-06-2014,01-08-2104 these dates
- Mark as New
- Bookmark
- Subscribe
- Mute
- Subscribe to RSS Feed
- Permalink
- Report Inappropriate Content
When I open your attachment I see this and it looks good:

Congratulation! Looks good.
Burkhard
- Mark as New
- Bookmark
- Subscribe
- Mute
- Subscribe to RSS Feed
- Permalink
- Report Inappropriate Content
hey i am asking why my date dimension is not showing all fields in the chart??
- Mark as New
- Bookmark
- Subscribe
- Mute
- Subscribe to RSS Feed
- Permalink
- Report Inappropriate Content
Hi Kannuri,
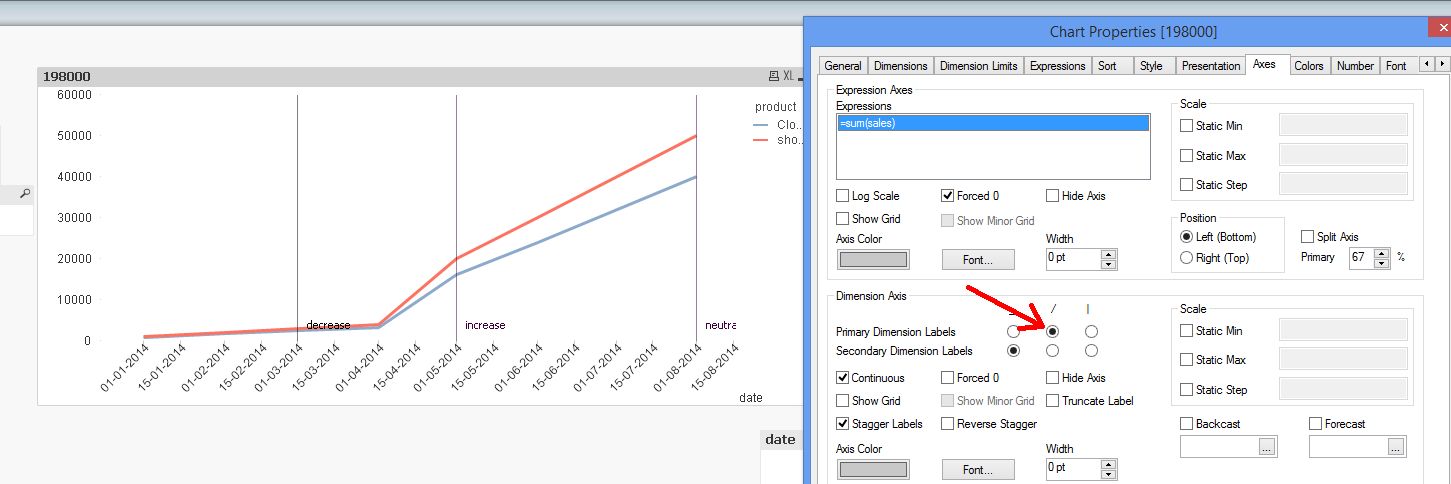
this is a scaling problem only. If you enlarge your chart to double or triple length you will see all the dates. Or if you use the inclined representation on the axis...

Everything is there, Kannuri, nothing is lost.
Burkhard
- Mark as New
- Bookmark
- Subscribe
- Mute
- Subscribe to RSS Feed
- Permalink
- Report Inappropriate Content
HI Burkhard,
Thanks a lot for your quick response and reply ..still i have a query ![]() ..why the date dimension is showing
..why the date dimension is showing
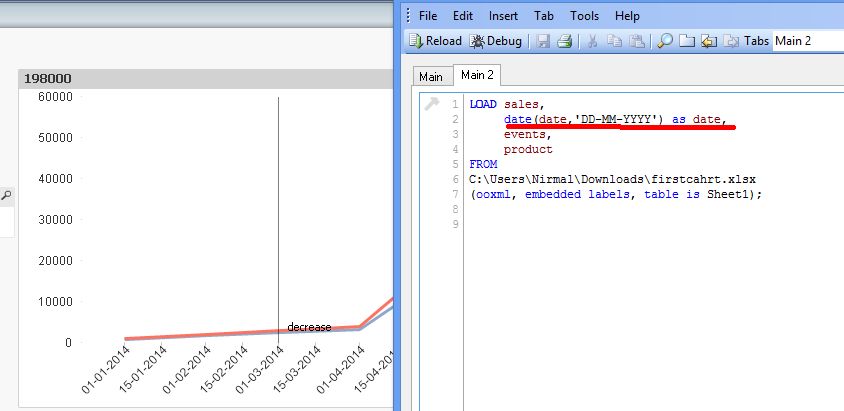
15-01-2014,15-02-2014........like this, these fields are not there in the DATE
- Mark as New
- Bookmark
- Subscribe
- Mute
- Subscribe to RSS Feed
- Permalink
- Report Inappropriate Content
Hi Kannuri,
this is because you tell QV to do so. See your script:

- Mark as New
- Bookmark
- Subscribe
- Mute
- Subscribe to RSS Feed
- Permalink
- Report Inappropriate Content
HI Burkhard,
Is there any possibility for me to show my x-axis in string like jan 2014(mm-yyyy) ??
- Mark as New
- Bookmark
- Subscribe
- Mute
- Subscribe to RSS Feed
- Permalink
- Report Inappropriate Content
Yes you can , take the calculated dimension as follows
Month&'-'&Year
you can also do ni backend
Month&'-'&Year as MonthYear