Unlock a world of possibilities! Login now and discover the exclusive benefits awaiting you.
- Qlik Community
- :
- All Forums
- :
- QlikView App Dev
- :
- Re: Reference line to be always displayed - Static...
- Subscribe to RSS Feed
- Mark Topic as New
- Mark Topic as Read
- Float this Topic for Current User
- Bookmark
- Subscribe
- Mute
- Printer Friendly Page
- Mark as New
- Bookmark
- Subscribe
- Mute
- Subscribe to RSS Feed
- Permalink
- Report Inappropriate Content
Reference line to be always displayed - Static Min Doesnt Work.
Hello,
please refer to example app in attachment.
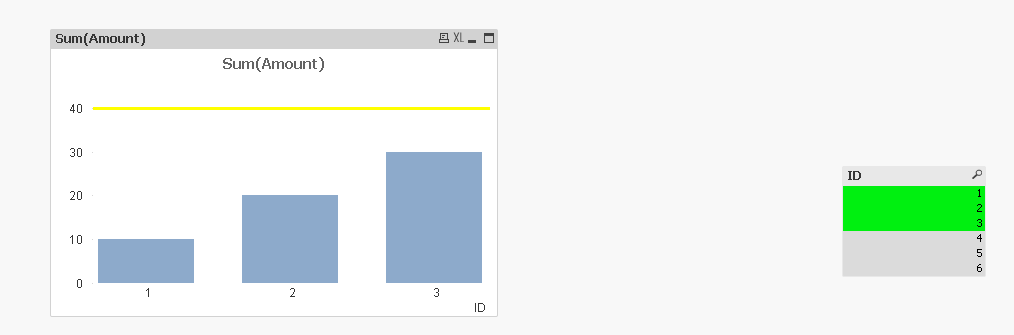
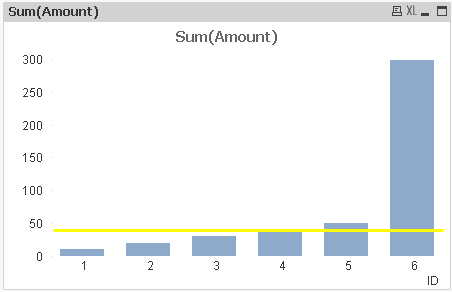
I Set a reference line, which I want to have always displayed. If the Amount is Above the reference line, it should scale to that amount, like this:

This is OK.
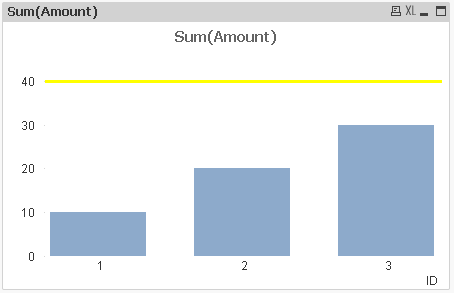
But when I make a selection where every amount is substantially below the amount of reference line, the line disappears (it is not scaled to the amount of reference line).:

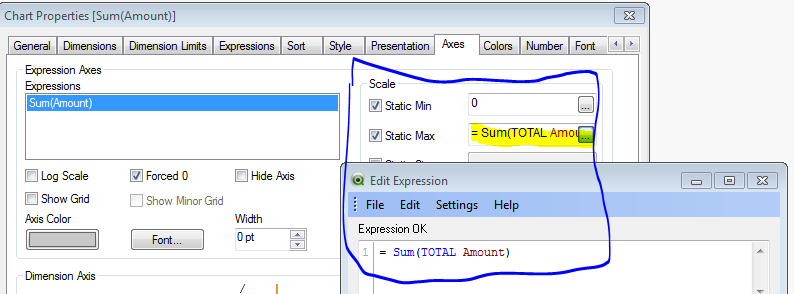
What I tried to do, is to set static min for the amount of reference line, which is 40 here, si the static min is =40.
So the point is, that I need reference line to be always displayed.
Thank you for help.
- « Previous Replies
-
- 1
- 2
- Next Replies »
Accepted Solutions
- Mark as New
- Bookmark
- Subscribe
- Mute
- Subscribe to RSS Feed
- Permalink
- Report Inappropriate Content
See attachment.
=rangemax(45,max(aggr(sum(Amount),ID))) in Static Max field.
- Mark as New
- Bookmark
- Subscribe
- Mute
- Subscribe to RSS Feed
- Permalink
- Report Inappropriate Content
Did you mean to set Static Max?
- Mark as New
- Bookmark
- Subscribe
- Mute
- Subscribe to RSS Feed
- Permalink
- Report Inappropriate Content
See attachment.
=rangemax(45,max(aggr(sum(Amount),ID))) in Static Max field.
- Mark as New
- Bookmark
- Subscribe
- Mute
- Subscribe to RSS Feed
- Permalink
- Report Inappropriate Content
May be increase your scale is one way try below.
- Mark as New
- Bookmark
- Subscribe
- Mute
- Subscribe to RSS Feed
- Permalink
- Report Inappropriate Content
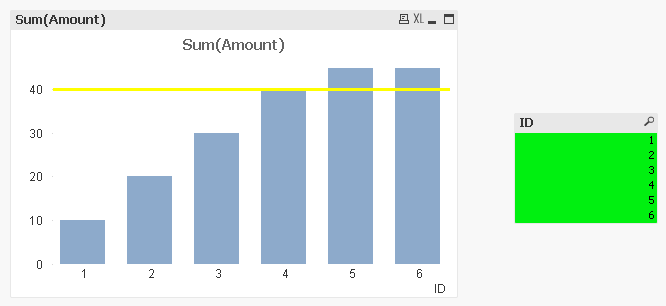
When I select All values, bar for ID 6 is not going all the way to 300:
- Mark as New
- Bookmark
- Subscribe
- Mute
- Subscribe to RSS Feed
- Permalink
- Report Inappropriate Content
Use the suggestion above from atkinsow
- Mark as New
- Bookmark
- Subscribe
- Mute
- Subscribe to RSS Feed
- Permalink
- Report Inappropriate Content
Thank you Wallo, but, I just find this solution too complex for my basic need. Because I already have my sum too complex with checking several conditions and also with aggr and all that stuff. Now My chart has several changing dimension based on conditions and I will need to do aggr for each different dimension. Well the point is, not quite usable for complexity.
Maybe someone know some better way?
I just need graph to always display reference line, even if my data are substantially below it.
Thank you for help.
- Mark as New
- Bookmark
- Subscribe
- Mute
- Subscribe to RSS Feed
- Permalink
- Report Inappropriate Content
Sorry if it seems too complex.
My recommendation does address your issue and increases if max bar is much higher.
I'm not sure there is another comparable way.
Because you don't just need to see the reference line you also need the axis to increase if it's much higher than the reference line. You actually have 2 requirements.
If it was really just that you needed to see the reference line, you could set axis to 45 max and you'd be done.
It might help if you provided your actual expression.
- Mark as New
- Bookmark
- Subscribe
- Mute
- Subscribe to RSS Feed
- Permalink
- Report Inappropriate Content
Did my below solution did not work? May be i am missing something.
- Mark as New
- Bookmark
- Subscribe
- Mute
- Subscribe to RSS Feed
- Permalink
- Report Inappropriate Content
Vish
Yours would technically work. But it would end up causing the axis to be much higher than the tallest bar. For instance if you have 3 dimensions and Dim1 =10, Dim2=20, Dim3=30; your formula would make the axis max 60 even though the highest bar is only 30.
- « Previous Replies
-
- 1
- 2
- Next Replies »