Unlock a world of possibilities! Login now and discover the exclusive benefits awaiting you.
- Qlik Community
- :
- All Forums
- :
- QlikView App Dev
- :
- Reference lines
- Subscribe to RSS Feed
- Mark Topic as New
- Mark Topic as Read
- Float this Topic for Current User
- Bookmark
- Subscribe
- Mute
- Printer Friendly Page
- Mark as New
- Bookmark
- Subscribe
- Mute
- Subscribe to RSS Feed
- Permalink
- Report Inappropriate Content
Reference lines
Hi all
Under Presentation / Reference Lines I can add a Y axis (horizontal) reference line. No big deal.
Is it possible to create an X axis reference line (vertical) that will move with passage of time in the chart?
I need to set a "marker" on July 2016 to distinguish all that was prior and after July.
Thanks
Accepted Solutions
- Mark as New
- Bookmark
- Subscribe
- Mute
- Subscribe to RSS Feed
- Permalink
- Report Inappropriate Content
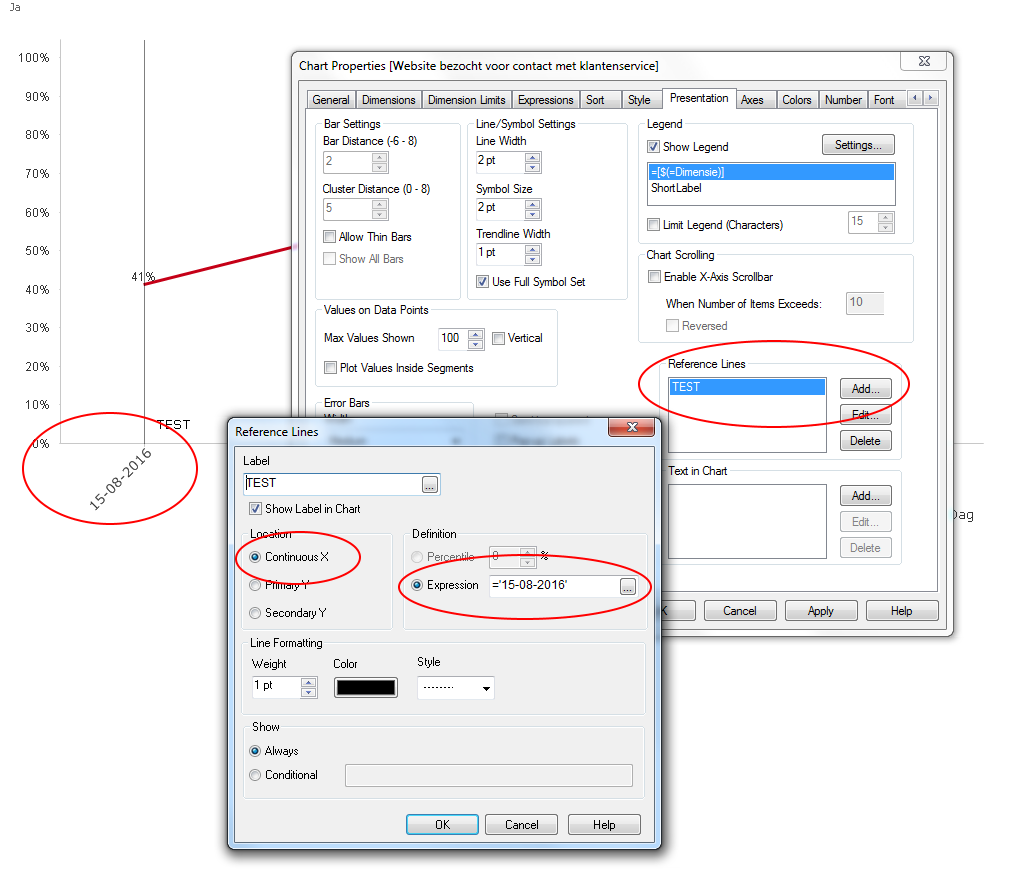
Yes, but you must set the x axis to continuous in the axes tab and then set the reference line in the presentation tab like this
- Mark as New
- Bookmark
- Subscribe
- Mute
- Subscribe to RSS Feed
- Permalink
- Report Inappropriate Content
Can you share a sample app if possible please ?
- Mark as New
- Bookmark
- Subscribe
- Mute
- Subscribe to RSS Feed
- Permalink
- Report Inappropriate Content
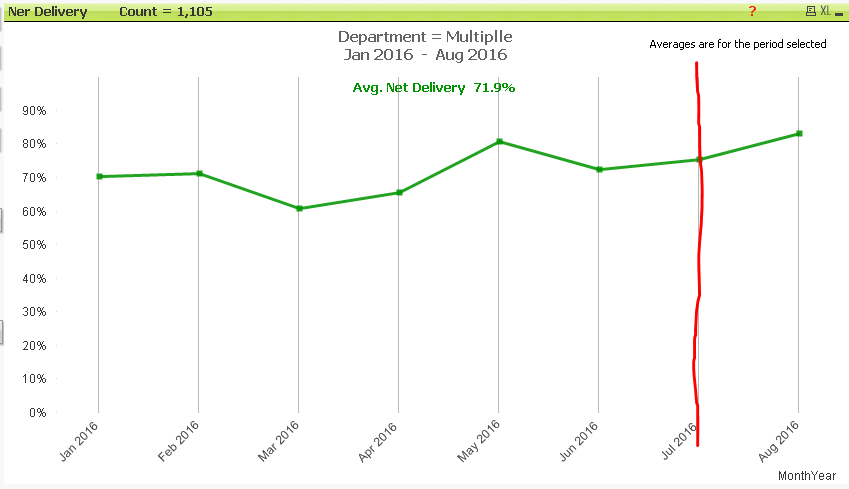
I cannot share the application as it is too large but here is a snapshot of what I need:
Vertical line on July 2016 that will move with the month until it falls off the chart unless wider range of dates is selected.
Does r this help?
- Mark as New
- Bookmark
- Subscribe
- Mute
- Subscribe to RSS Feed
- Permalink
- Report Inappropriate Content
- Mark as New
- Bookmark
- Subscribe
- Mute
- Subscribe to RSS Feed
- Permalink
- Report Inappropriate Content
Yes, but you must set the x axis to continuous in the axes tab and then set the reference line in the presentation tab like this
- Mark as New
- Bookmark
- Subscribe
- Mute
- Subscribe to RSS Feed
- Permalink
- Report Inappropriate Content
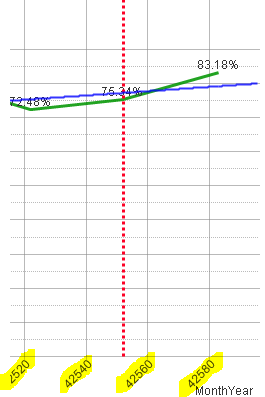
Beautiful!
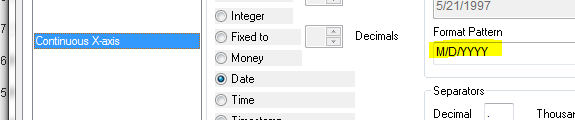
However, it changes the dates on the X axis to numerical value instead of the Month's name.
How do I show the month name then?
- Mark as New
- Bookmark
- Subscribe
- Mute
- Subscribe to RSS Feed
- Permalink
- Report Inappropriate Content
OK I got it. In number set up
Thanks you!!!