Unlock a world of possibilities! Login now and discover the exclusive benefits awaiting you.
- Qlik Community
- :
- All Forums
- :
- QlikView App Dev
- :
- Re: Relative field total works on pivot table, but...
- Subscribe to RSS Feed
- Mark Topic as New
- Mark Topic as Read
- Float this Topic for Current User
- Bookmark
- Subscribe
- Mute
- Printer Friendly Page
- Mark as New
- Bookmark
- Subscribe
- Mute
- Subscribe to RSS Feed
- Permalink
- Report Inappropriate Content
Relative field total works on pivot table, but not in chart!
Hello everyone,
I am doing a stacked distribution of a category field of functions sum and count. When i select only one week, i can see exactly what i'm looking for as in the example below.
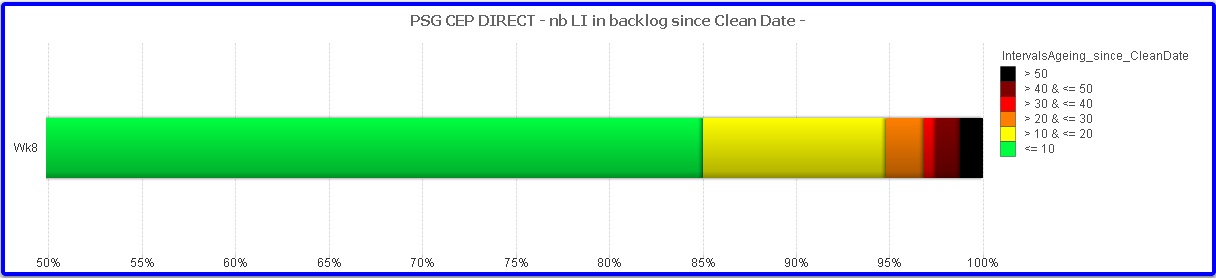
At first my expression was: "=count([Backlog Quantity])" Checking on RELATIVE and with my category field as dimension. When selecting few weeks it stopped working as i imagine it picks the relative to the total of all weeks selected. Giving a white chart.
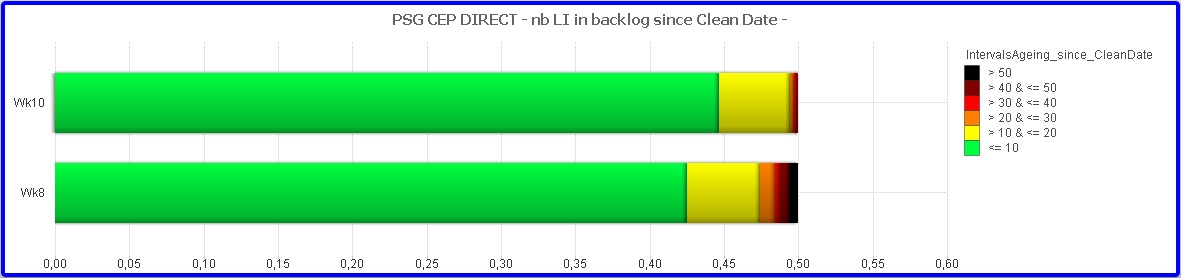
To solve this i tried to implement the expression "=count([Backlog Quantity])/count(TOTAL<WeekNum> [Backlog Quantity])" and UNCHECKING the RELATIVE. Then what i got for two weeks was:
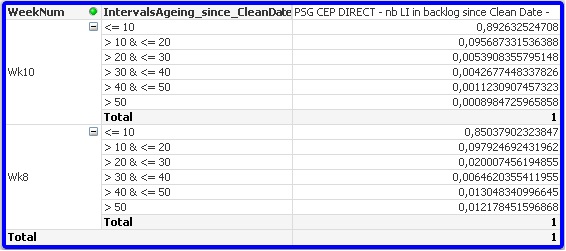
But in this cames both distributions come up to 50% each instead of 100%. The strange thing anyway is that when i convert this chart into a pivot table i get the numbers which i'm expecting on the charts as you can see below:
Though i see the final total is 1 when it should be 2...
Those someone know where the problem might be and how could i have the graph i'm expecting?
Thanks in advance!!!
Alberto Foret Armadans
- Mark as New
- Bookmark
- Subscribe
- Mute
- Subscribe to RSS Feed
- Permalink
- Report Inappropriate Content
post sample file please:)