Unlock a world of possibilities! Login now and discover the exclusive benefits awaiting you.
- Qlik Community
- :
- All Forums
- :
- QlikView App Dev
- :
- Re: Rename Data when Reading(Loading) from SQL Ser...
- Subscribe to RSS Feed
- Mark Topic as New
- Mark Topic as Read
- Float this Topic for Current User
- Bookmark
- Subscribe
- Mute
- Printer Friendly Page
- Mark as New
- Bookmark
- Subscribe
- Mute
- Subscribe to RSS Feed
- Permalink
- Report Inappropriate Content
Rename Data when Reading(Loading) from SQL Server
Hello Guys
I have a table which i am loading it from SQL Server 2008,
I want to rename the data in a way which is understandable to Users,
for Example:
I have 12 columns which each one has 5 possible values (1 or 4 or 9 or 16 or 25), i want to represent these data as (Highly disagree, disagree, no opinion, agree, highly agree)
take a look at this image:
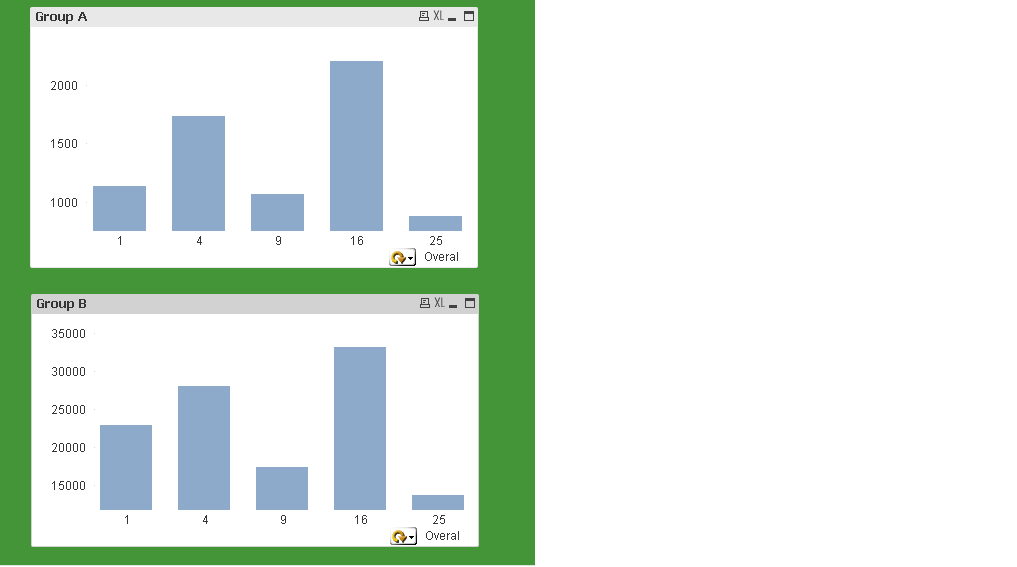
as you see in the above picture, many users wont understand the meaning of these numbers!.
thanks
- Tags:
- qlikview_scripting
Accepted Solutions
- Mark as New
- Bookmark
- Subscribe
- Mute
- Subscribe to RSS Feed
- Permalink
- Report Inappropriate Content
in chart
if GroupA is your dimension in bar chart you can replace with a calculated dimension
=pick(match(GroupA,1,4,9,16,25), 'Highly disagree', 'disagree', 'no opinion', 'agree', 'highly agree')
or if you prefer you can do the same thing in the script
// make some test data with 1, 2, 9, 16, 25
sqlserver:
Load
rowno() as id,
Pick(Ceil(5*Rand1),1,4,9,16,25) as GroupA;
Load
Rand() as Rand1
Autogenerate 1000
While Rand()<=0.5 or IterNo()=1;
// replace 1,4,9.... with Highly......
final:
load
id,
pick(match(GroupA,1,4,9,16,25), 'Highly disagree', 'disagree', 'no opinion', 'agree', 'highly agree') as NewGroupA,
GroupA
Resident
sqlserver;
drop table sqlserver;
- Mark as New
- Bookmark
- Subscribe
- Mute
- Subscribe to RSS Feed
- Permalink
- Report Inappropriate Content
Hi Arman
Use cross table and combine all those 11 columns into one and then you can easily rename the values to whatever you like
thanks and regards
Padma
- Mark as New
- Bookmark
- Subscribe
- Mute
- Subscribe to RSS Feed
- Permalink
- Report Inappropriate Content
in chart
if GroupA is your dimension in bar chart you can replace with a calculated dimension
=pick(match(GroupA,1,4,9,16,25), 'Highly disagree', 'disagree', 'no opinion', 'agree', 'highly agree')
or if you prefer you can do the same thing in the script
// make some test data with 1, 2, 9, 16, 25
sqlserver:
Load
rowno() as id,
Pick(Ceil(5*Rand1),1,4,9,16,25) as GroupA;
Load
Rand() as Rand1
Autogenerate 1000
While Rand()<=0.5 or IterNo()=1;
// replace 1,4,9.... with Highly......
final:
load
id,
pick(match(GroupA,1,4,9,16,25), 'Highly disagree', 'disagree', 'no opinion', 'agree', 'highly agree') as NewGroupA,
GroupA
Resident
sqlserver;
drop table sqlserver;
- Mark as New
- Bookmark
- Subscribe
- Mute
- Subscribe to RSS Feed
- Permalink
- Report Inappropriate Content
- create a mapping table
- use applymap during load of your data
- maybe combine with the dual function, so your original numerical values are still available for sorting purposes.
regards
Marco
- Mark as New
- Bookmark
- Subscribe
- Mute
- Subscribe to RSS Feed
- Permalink
- Report Inappropriate Content
Thanks Buddy, that works like a charm.
i like to see the dimension in a order i want. how to sort them? i know i can go to the sort tab and i should write an Expression beside Expression check box.
but what Expression?
Something like :
SortInThisWay('Highly Disagree','Disagree','No Opinion','Agree','Highly Agree')
I need to tell you that i created a cyclic group including 12 Expressions one for each column.
the name of this Cyclic group is QST, i tried this for sorting:
Match(QST,'Highly Disagree','Disagree','No Opinion','Agree','Highly Agree')
but it says bad field name : QST because QST is not actually a field