Unlock a world of possibilities! Login now and discover the exclusive benefits awaiting you.
- Qlik Community
- :
- All Forums
- :
- QlikView App Dev
- :
- Re: Replace previous value in listbox after unmark
- Subscribe to RSS Feed
- Mark Topic as New
- Mark Topic as Read
- Float this Topic for Current User
- Bookmark
- Subscribe
- Mute
- Printer Friendly Page
- Mark as New
- Bookmark
- Subscribe
- Mute
- Subscribe to RSS Feed
- Permalink
- Report Inappropriate Content
Replace previous value in listbox after unmark
Hi,
- I have a 3 fields(cure,MinCure, MaxCure) and taken i a table box. MinCure & MaxCure are INPUTFIELDS.
- In the listbox i add Field "Cure" and Expressions with MinCure,MaxCure with presentation WindowsCheckBoxes.

- Now when i check "A" in listbox and i will change the value of MinCure 1 with 10(MinCure is inputfield). This will replace in the field Min with 10 of listbox of A row.
- But when i uncheck "A" i want to appear old value 1 under min of A row.
I'm attaching sample qvw file also for your reference.
How can i do this. Is it possible to do.
- Mark as New
- Bookmark
- Subscribe
- Mute
- Subscribe to RSS Feed
- Permalink
- Report Inappropriate Content
Hi,
Say for example.
You have a field Called A which has values from 1 to 100. You want user to give min and max he want to see from field A.
Create two variable. Say Var1, Var2. Add input box. Set Var1 as min and Var2 as max.
Create a chart with fild A as dimension and Expression as below.
Sum({<A = {">=$(Var1)<=$(Var2)"}>}1)
Instead of 1 you can have field.
Click ok.
Input min and max from inputbox and see the change in your chart/Table.
Regards,
Kaushik Solanki
- Mark as New
- Bookmark
- Subscribe
- Mute
- Subscribe to RSS Feed
- Permalink
- Report Inappropriate Content
kaushik,
Can you please leave that what is the next i'm doing. Please give me the solution for 1st requested post.
Qliksus had given some solution but i not able to do where i need to add that action.
- Mark as New
- Bookmark
- Subscribe
- Mute
- Subscribe to RSS Feed
- Permalink
- Report Inappropriate Content
Hi,
I dont know what logic Qliksus applied but he want you to add that expression in list box.
Create a list box -> select expression (You will find this at the bottom in the list if field) -> Paste the expression there.
Regards,
Kaushik Solanki
- Mark as New
- Bookmark
- Subscribe
- Mute
- Subscribe to RSS Feed
- Permalink
- Report Inappropriate Content
Hi,
Qliksus said like this in the script should be as following:
INPUTFIELD MaxCure,MinCure;
Table1:
LOAD Cure,
MaxCure,
MinCure,
MaxCure as MaxCure1,
MinCure as MinCure1
FROM
D:\Examples\TB01_20110624_103856.xls
(biff, embedded labels, table is Sheet1$);
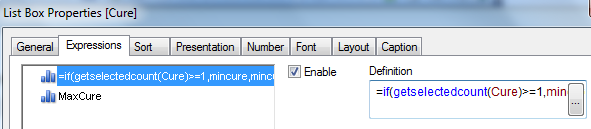
- Then in the list box add field "Cure" and the list box contains the expression tab in this i add the code =if(getselectedcount(Cure)>=1,mincure,mincure1)
- But it is not working for me.
- Mark as New
- Bookmark
- Subscribe
- Mute
- Subscribe to RSS Feed
- Permalink
- Report Inappropriate Content
Hi,
Let me tell you what i understood.
You have a field A which has value from 1-100 and you have a chart say straight table.
Now you want user to input min and max value he want to show from the field a.
i.e if he selects min =10 and max =20, then he should see all values from A field which are in between this min and max in chart.
Am i right..?
Regards,
Kaushik Solanki
- Mark as New
- Bookmark
- Subscribe
- Mute
- Subscribe to RSS Feed
- Permalink
- Report Inappropriate Content
Yes by using set analysis i can filter the straight table. As you said i need to take two input variables based on inputs it will filter the straight table.This example i had tried previosly.
- But how can i overcome this task now. I had attached my qvw file in the previous post in that if you add this expression like this.
=if(getselectedcount(Cure)>=1,'A','B')
- It is working fine but if we add fields it is not working..
- Mark as New
- Bookmark
- Subscribe
- Mute
- Subscribe to RSS Feed
- Permalink
- Report Inappropriate Content
Hi sorry for the late reply what i understood was you have to revert back to the old value eventhough u are changing
the value of field. Say for example u have the field mincure which is a inputfield so u can change that to any value
during selection but when u deselect the initial value should be retained in that case i have created one more
column and have not added to the inputfield so that the initial value will be retained and i have created the
expression which will just change the values when u add it in the list box
Please let me know if i understood u wrongly
- Mark as New
- Bookmark
- Subscribe
- Mute
- Subscribe to RSS Feed
- Permalink
- Report Inappropriate Content
Hi,
I dont understand why you want to go with this expression when you can achieve same with the set analysis.
Regards,
Kaushik Solanki
- Mark as New
- Bookmark
- Subscribe
- Mute
- Subscribe to RSS Feed
- Permalink
- Report Inappropriate Content
Qliksus,
what you said is correct. I tried with your code it is not working but when i tried with string value like it is working. I don't know y it is not working with field values.
- I tried like this:
=if(getselectedcount(Cure)>=1,'A','B')
- Mark as New
- Bookmark
- Subscribe
- Mute
- Subscribe to RSS Feed
- Permalink
- Report Inappropriate Content
jagannalla ,
its working for me in the file u have attached i can attach the file but u cant open that i guess bcoz of the personal
edition So paste your expression i will try here and let u know what u are missing