Unlock a world of possibilities! Login now and discover the exclusive benefits awaiting you.
Announcements
April 13–15 - Dare to Unleash a New Professional You at Qlik Connect 2026: Register Now!
- Qlik Community
- :
- All Forums
- :
- QlikView App Dev
- :
- Replicating a graph
Options
- Subscribe to RSS Feed
- Mark Topic as New
- Mark Topic as Read
- Float this Topic for Current User
- Bookmark
- Subscribe
- Mute
- Printer Friendly Page
Turn on suggestions
Auto-suggest helps you quickly narrow down your search results by suggesting possible matches as you type.
Showing results for
Creator III
2017-06-30
09:41 AM
- Mark as New
- Bookmark
- Subscribe
- Mute
- Subscribe to RSS Feed
- Permalink
- Report Inappropriate Content
Replicating a graph
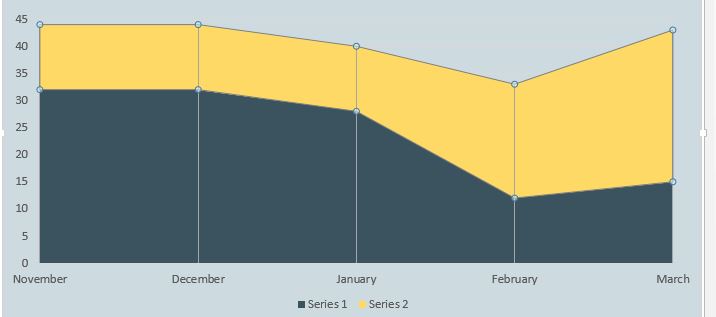
Within a powerpoint slide, i received this graph.
When i edited the data, i saw that it was a combo chart.
I am wondering if Qlikview combo charts can replicate this graph.
I have a Qlikview stacked graph at the moment but wondering how to do the above graph or can it be done?
1,030 Views
1 Solution
Accepted Solutions
Partner - Creator III
2017-06-30
09:47 AM
- Mark as New
- Bookmark
- Subscribe
- Mute
- Subscribe to RSS Feed
- Permalink
- Report Inappropriate Content
982 Views
5 Replies
Specialist
2017-06-30
09:43 AM
- Mark as New
- Bookmark
- Subscribe
- Mute
- Subscribe to RSS Feed
- Permalink
- Report Inappropriate Content
If you have all the data, what's the problem to replicate this graph in QV?
982 Views
Creator III
2017-06-30
09:45 AM
Author
- Mark as New
- Bookmark
- Subscribe
- Mute
- Subscribe to RSS Feed
- Permalink
- Report Inappropriate Content
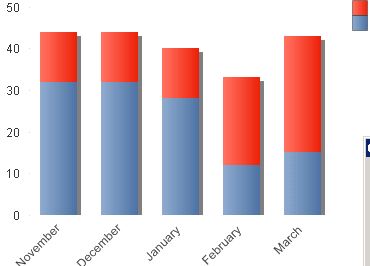
This is what i get. I want to replicate the top picture
982 Views
Partner - Creator III
2017-06-30
09:47 AM
- Mark as New
- Bookmark
- Subscribe
- Mute
- Subscribe to RSS Feed
- Permalink
- Report Inappropriate Content
You can use the line chart with this style/look:
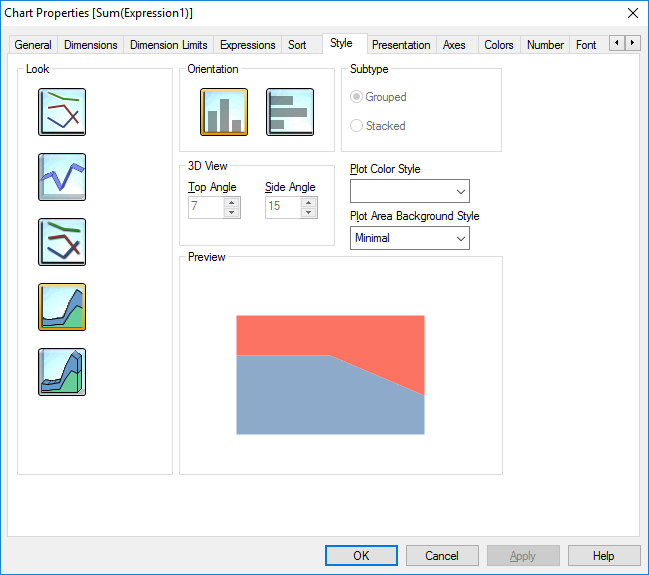
983 Views
Specialist
2017-06-30
09:48 AM
- Mark as New
- Bookmark
- Subscribe
- Mute
- Subscribe to RSS Feed
- Permalink
- Report Inappropriate Content
Then you must to change this style to lines.
982 Views
Creator III
2017-06-30
09:49 AM
Author
- Mark as New
- Bookmark
- Subscribe
- Mute
- Subscribe to RSS Feed
- Permalink
- Report Inappropriate Content
Thats it David.
I got it working with your advice. My bad, I was using combo chart.
Appreciate the help
982 Views