Unlock a world of possibilities! Login now and discover the exclusive benefits awaiting you.
- Qlik Community
- :
- All Forums
- :
- QlikView App Dev
- :
- Retrieving Percentage Values
- Subscribe to RSS Feed
- Mark Topic as New
- Mark Topic as Read
- Float this Topic for Current User
- Bookmark
- Subscribe
- Mute
- Printer Friendly Page
- Mark as New
- Bookmark
- Subscribe
- Mute
- Subscribe to RSS Feed
- Permalink
- Report Inappropriate Content
Retrieving Percentage Values
Hey Community,
Currently I am trying to represent my data through Bar Charts as percentages. For example I have three main categories Functional, Non-Functional, & Business. So if the breakdown was 30, 50, & 20 respectively, I want to represent this data as 30%, 50%, & 20% instead of the actual values of 30, 50, & 20. Would I have to change a setting in the graph properties or use a query to derive this data? Any suggestions on making this change? ![]()
Thank you,
Peter
Accepted Solutions
- Mark as New
- Bookmark
- Subscribe
- Mute
- Subscribe to RSS Feed
- Permalink
- Report Inappropriate Content
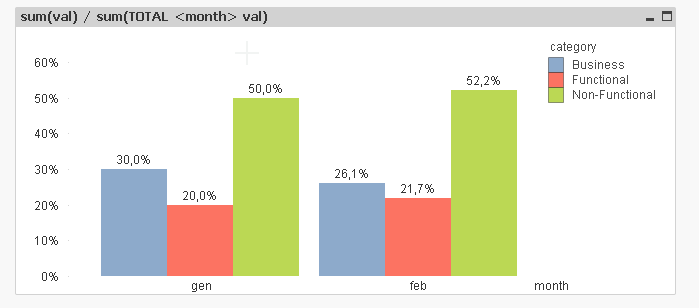
this? if yes
- uncheck relative
- sum(val) / sum(TOTAL <month> val)
- in number tab check show in percent

- Mark as New
- Bookmark
- Subscribe
- Mute
- Subscribe to RSS Feed
- Permalink
- Report Inappropriate Content
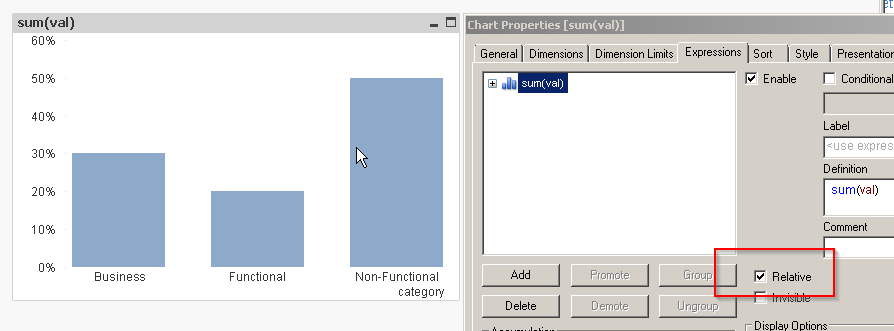
check Relative in Expression tab

- Mark as New
- Bookmark
- Subscribe
- Mute
- Subscribe to RSS Feed
- Permalink
- Report Inappropriate Content
Thank you Massimo!
- Mark as New
- Bookmark
- Subscribe
- Mute
- Subscribe to RSS Feed
- Permalink
- Report Inappropriate Content
Hey Massimo/Community,
If I am adding multiple dates for the categories, it seems it is taking the percentages of the values for the total amount instead of taking the percentage of the total amount for the specified date. For example if I want the breakdown for functional, non functional and business for August v. September, the percentage is calculated by the total values of both months. So instead of receiving the total percentage of functional observations for the month of August v. Sep it is giving me the percentage of functional observations ( August)/Total amount of issues for both of August and Sep. Is there a way I can get a graph where it will give me a percentage breakdown of the categories based on their respective numbers? So if I were to add months June - Sep, I can get the percentage of functional issues respective towards their numbers for all the months in one graph. Thanks for the help. ![]()
Peter
- Mark as New
- Bookmark
- Subscribe
- Mute
- Subscribe to RSS Feed
- Permalink
- Report Inappropriate Content
this? if yes
- uncheck relative
- sum(val) / sum(TOTAL <month> val)
- in number tab check show in percent

- Mark as New
- Bookmark
- Subscribe
- Mute
- Subscribe to RSS Feed
- Permalink
- Report Inappropriate Content
Yes! Thank you Massimo!