Unlock a world of possibilities! Login now and discover the exclusive benefits awaiting you.
- Qlik Community
- :
- All Forums
- :
- QlikView App Dev
- :
- Re: Rolling 12 Months Calculations on Month to Mon...
- Subscribe to RSS Feed
- Mark Topic as New
- Mark Topic as Read
- Float this Topic for Current User
- Bookmark
- Subscribe
- Mute
- Printer Friendly Page
- Mark as New
- Bookmark
- Subscribe
- Mute
- Subscribe to RSS Feed
- Permalink
- Report Inappropriate Content
Rolling 12 Months Calculations on Month to Month
I am very new to Qlik and working on a what I feel is a difficult chart. I am trying to do this as a Set Analysis but not having any luck.
I would really appreciate any help on this.
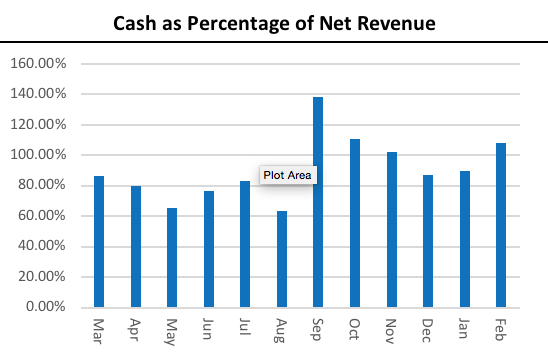
This will be a rolling 12-month chart as layout below
Total charges posted in Jan divided by the total cash received in Feb giving you the Pct for Feb.
Total charges posted in Dec divided by the total cash received in Jan giving you the Pct for Jan,
Total charges posted in Nov divided by the total cash received in Dec giving you the Pct for Dec
Total charges posted in Oct divided by the total cash received in Nov giving you the Pct for Nov
Total charges posted in Sept divided by the total cash received in Oct giving you the Pct for Oct
etc...
- Mark as New
- Bookmark
- Subscribe
- Mute
- Subscribe to RSS Feed
- Permalink
- Report Inappropriate Content
A couple of questions, does your data table have a DATE field and are you using a calendar table?
- Mark as New
- Bookmark
- Subscribe
- Mute
- Subscribe to RSS Feed
- Permalink
- Report Inappropriate Content
Hi Jerry thank you for the help.
Yes it has a date field, not sure about the calendar table I would say I am not using it. What is the calendar table?
- Mark as New
- Bookmark
- Subscribe
- Mute
- Subscribe to RSS Feed
- Permalink
- Report Inappropriate Content
You can show example with data here?
- Mark as New
- Bookmark
- Subscribe
- Mute
- Subscribe to RSS Feed
- Permalink
- Report Inappropriate Content
Charge File
Charge Svc Date Charge Amount
01/28/2018 $500.00
01/29/2018 $200.00
02/15/2018 $100.00
02/01/2018 $300.00
03/11/2018 $100.00
03/15/2018 $300.00
Cash File
Cash Post Date Cash Amount
02/02/2018 $250.00
02/20/2018 $125.00
02/15/2018 $160.00
03/20/2018 $300.00
03/22/2018 $25.00
Charge Total for Jan = 700.00/Cash Total for Feb = 535.00
Charge Total / Cash Total = 76%
The trick is that I need show this over 12 months, so as we showed the pct for Jan and Feb, then we need to show
Cash/Charges
Jan / Dec
Dec / Nov
Nov / Oct
Oct / Sept
Sept / Aug
Aug / July
July / June
June / May
May / April
April / March
March / Feb
Feb / Jan
- Mark as New
- Bookmark
- Subscribe
- Mute
- Subscribe to RSS Feed
- Permalink
- Report Inappropriate Content
!Try this ...
SET ThousandSep='.';
SET DecimalSep=',';
SET MoneyThousandSep='.';
SET MoneyDecimalSep=',';
SET MoneyFormat='R$ #.##0,00;-R$ #.##0,00';
SET TimeFormat='hh:mm:ss';
SET DateFormat='MM/DD/YYYY';
SET TimestampFormat='MM/DD/YYYY hh:mm:ss[.fff]';
SET FirstWeekDay=6;
SET BrokenWeeks=1;
SET ReferenceDay=0;
SET FirstMonthOfYear=1;
SET CollationLocale='pt-BR';
SET MonthNames='jan;fev;mar;abr;mai;jun;jul;ago;set;out;nov;dez';
SET LongMonthNames='janeiro;fevereiro;março;abril;maio;junho;julho;agosto;setembro;outubro;novembro;dezembro';
SET DayNames='seg;ter;qua;qui;sex;sáb;dom';
SET LongDayNames='segunda-feira;terça-feira;quarta-feira;quinta-feira;sexta-feira;sábado;domingo';
[Charge File]:
Load * inline [
Charge Svc Date, Charge Amount
01/28/2018, 500,00
01/29/2018, 200,00
02/15/2018, 100,00
02/01/2018, 300,00
03/11/2018, 100,00
03/15/2018, 300,00
];
[Cash File]:
load * inline [
Cash Post Date, Cash Amount
02/02/2018, 250,00
02/20/2018, 125,00
02/15/2018, 160,00
03/20/2018, 300,00
03/22/2018, 25,00
];
join ([Charge File])
load
date#([Cash Post Date]) as [Charge Svc Date],
[Cash Amount]
Resident [Cash File];
drop table [Cash File];
- Mark as New
- Bookmark
- Subscribe
- Mute
- Subscribe to RSS Feed
- Permalink
- Report Inappropriate Content
Hi Antonio, thank you very much. I will try this.
- Mark as New
- Bookmark
- Subscribe
- Mute
- Subscribe to RSS Feed
- Permalink
- Report Inappropriate Content
I believe a calendar table helps in displaying dates and provides an easy way to filter data by dates, years, months days. I loaded the MonthBased calender from the script in this URL (Calendars). The calendar is useful in set analysis.
I loaded your sample data:
[Charge File]:
LOAD Date(Date(ChargeSvcDate,'MM/DD/YYYY'),'M/D/YYYY') as ChargeSvcDate,
Date(Date(ChargeSvcDate,'MM/DD/YYYY'),'M/D/YYYY') as Date,
ChargeAmount;
LOAD * Inline [
ChargeSvcDate,ChargeAmount
01/28/2018,500.00
01/29/2018,200.00
02/15/2018,100.00
02/01/2018,300.00
03/11/2018,100.00
03/15/2018,300.00
];
[Cash File]:
LOAD Date(Date(CashPostDate,'MM/DD/YYYY'),'M/D/YYYY') as CashPostDate,
Date(Date(CashPostDate,'MM/DD/YYYY'),'M/D/YYYY') as Date,
CashAmount;
LOAD * Inline [
CashPostDate,CashAmount
02/02/2018,250.00
02/20/2018,125.00
02/15/2018,160.00
03/20/2018,300.00
03/22/2018,25.00
];
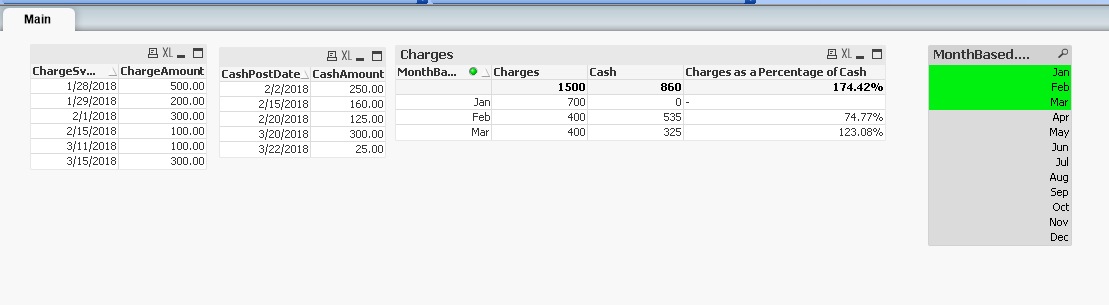
In the set analysis below, I use set the CashPostDate to match between the beginning and end of the next month of the current date associated with the charges.
=Sum(ChargeAmount) / Sum({$<CashPostDate={">=$(=Date(MonthStart(AddMonths([Date],1))'M/D/YYYY'))<=$(=Date(MonthEnd(AddMonths([Date],1)),'M/D/YYYY'))"}>}CashAmount)
- Mark as New
- Bookmark
- Subscribe
- Mute
- Subscribe to RSS Feed
- Permalink
- Report Inappropriate Content
Hi Jerry, Thank you very much. I will load your script also to see if this will work for me.