Unlock a world of possibilities! Login now and discover the exclusive benefits awaiting you.
- Qlik Community
- :
- All Forums
- :
- QlikView App Dev
- :
- Re: Rolling 12 month sum using above() in multi di...
- Subscribe to RSS Feed
- Mark Topic as New
- Mark Topic as Read
- Float this Topic for Current User
- Bookmark
- Subscribe
- Mute
- Printer Friendly Page
- Mark as New
- Bookmark
- Subscribe
- Mute
- Subscribe to RSS Feed
- Permalink
- Report Inappropriate Content
Rolling 12 month sum using above() in multi dimensional pivot table
Hello, I have the below table for which I was initially trying to calculate rolling 12 month sum of sales and display at month level.
| Month | grade | sale |
| 1 | A | 10 |
| 1 | B | 20 |
| 1 | C | 30 |
| 2 | A | 10 |
| 2 | B | 20 |
| 2 | C | 30 |
| 3 | A | 10 |
| 3 | B | 20 |
| 3 | C | 30 |
| 4 | A | 10 |
| 4 | B | 20 |
| 4 | C | 30 |
| 5 | A | 10 |
| 5 | B | 20 |
| 5 | C | 30 |
| 6 | A | 10 |
| 6 | B | 20 |
| 6 | C | 30 |
| 7 | A | 10 |
| 7 | B | 20 |
| 7 | C | 30 |
| 8 | A | 10 |
| 8 | B | 20 |
| 8 | C | 30 |
| 9 | A | 10 |
| 9 | B | 20 |
| 9 | C | 30 |
| 10 | A | 10 |
| 10 | B | 20 |
| 10 | C | 30 |
| 11 | A | 10 |
| 11 | B | 20 |
| 11 | C | 30 |
| 12 | A | 10 |
| 12 | B | 20 |
| 12 | C | 30 |
Initial output: I got this part correct.
| Month | sum(aggr(rangesum(above( total sum({<Month=>}sale),0,12)),Month)) |
| 1 | 60 |
| 2 | 120 |
| 3 | 180 |
| 4 | 240 |
| 5 | 300 |
| 6 | 360 |
| 7 | 420 |
| 8 | 480 |
| 9 | 540 |
| 10 | 600 |
| 11 | 660 |
| 12 | 720 |
But when I pull the second dimension into the pivot table, I am not seeing expected results for Rolling 12 months values for the combination of these dimensions.
| Month | grade | sum(aggr(rangesum(above(sum(sale),0,12)),Month,grade)) |
| 1 | A | 10 |
| 1 | B | 30 |
| 1 | C | 60 |
| 2 | A | 10 |
| 2 | B | 30 |
| 2 | C | 60 |
| 3 | A | 10 |
| 3 | B | 30 |
| 3 | C | 60 |
| 4 | A | 10 |
| 4 | B | 30 |
| 4 | C | 60 |
| 5 | A | 10 |
| 5 | B | 30 |
| 5 | C | 60 |
| 6 | A | 10 |
| 6 | B | 30 |
| 6 | C | 60 |
| 7 | A | 10 |
| 7 | B | 30 |
| 7 | C | 60 |
| 8 | A | 10 |
| 8 | B | 30 |
| 8 | C | 60 |
| 9 | A | 10 |
| 9 | B | 30 |
| 9 | C | 60 |
| 10 | A | 10 |
| 10 | B | 30 |
| 10 | C | 60 |
| 11 | A | 10 |
| 11 | B | 30 |
| 11 | C | 60 |
| 12 | A | 10 |
| 12 | B | 30 |
| 12 | C | 60 |
I expect to see:
| Month | grade | sum(aggr(rangesum(above(sum(sale),0,12)),Month,grade)) |
| 1 | A | 10 |
| 1 | B | 20 |
| 1 | C | 30 |
| 2 | A | 20 |
| 2 | B | 40 |
| 2 | C | 60 |
| 3 | A | 30 |
| 3 | B | 60 |
| 3 | C | 90 |
Any suggestions. I am not sure if I am doing this right. maybe above() is not the right function here.
I could do it longitudinal like this, which would give right results, but there are many such combination of dimensions in the actual data to do it this way.
| Month | sum(aggr(rangesum(above( total sum({<Month=,grade={'A'}>}sale),0,12)),Month)) | sum(aggr(rangesum(above( total sum({<Month=,grade={'B'}>}sale),0,12)),Month)) | sum(aggr(rangesum(above( total sum({<Month=,grade={'C'}>}sale),0,12)),Month)) |
| 1 | 10 | 20 | 30 |
| 2 | 20 | 40 | 60 |
| 3 | 30 | 60 | 90 |
| 4 | 40 | 80 | 120 |
| 5 | 50 | 100 | 150 |
| 6 | 60 | 120 | 180 |
| 7 | 70 | 140 | 210 |
| 8 | 80 | 160 | 240 |
| 9 | 90 | 180 | 270 |
| 10 | 100 | 200 | 300 |
| 11 | 110 | 220 | 330 |
| 12 | 120 | 240 | 360 |
- « Previous Replies
-
- 1
- 2
- Next Replies »
Accepted Solutions
- Mark as New
- Bookmark
- Subscribe
- Mute
- Subscribe to RSS Feed
- Permalink
- Report Inappropriate Content
- Mark as New
- Bookmark
- Subscribe
- Mute
- Subscribe to RSS Feed
- Permalink
- Report Inappropriate Content
Try like this by removing grade from Aggr Calculation
sum(aggr(rangesum(above(sum(sale),0,12)),Month))
- Mark as New
- Bookmark
- Subscribe
- Mute
- Subscribe to RSS Feed
- Permalink
- Report Inappropriate Content
if I remove grade in Aggr, I am getting all 'A's
| Month | grade | sum(aggr(rangesum(above(sum(sale),0,12)),Month)) |
| 1 | A | 60 |
| 2 | A | 120 |
| 3 | A | 180 |
| 4 | A | 240 |
| 5 | A | 300 |
| 6 | A | 360 |
| 7 | A | 420 |
| 8 | A | 480 |
| 9 | A | 540 |
| 10 | A | 600 |
| 11 | A | 660 |
| 12 | A | 720 |
- Mark as New
- Bookmark
- Subscribe
- Mute
- Subscribe to RSS Feed
- Permalink
- Report Inappropriate Content
Hi Siva,
Check this
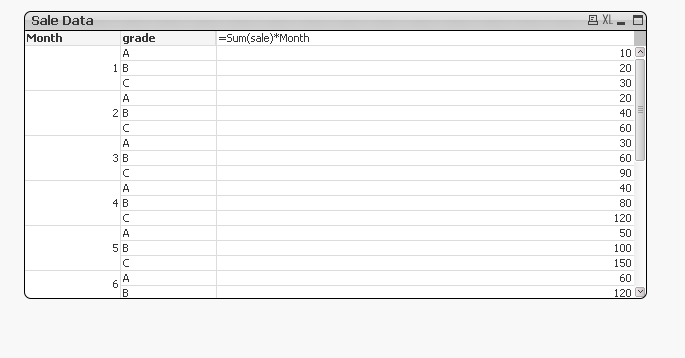
By using,
Sum(sale)*Month
as Expression.
You can Drag the Grade Dimension and place it horizontally to get your required longitude approach.
-Hirish
- Mark as New
- Bookmark
- Subscribe
- Mute
- Subscribe to RSS Feed
- Permalink
- Report Inappropriate Content
This would only work if your Sales are same throughout the year for each month. What if the Sales are like
1 A 10
1 B 20
1 C 30
1 A 15
1 B 8
1 C 10
Regards
Pratyush
- Mark as New
- Bookmark
- Subscribe
- Mute
- Subscribe to RSS Feed
- Permalink
- Report Inappropriate Content
I hope Pivot Will automatically Group those Month and Grade that gives you the result.
- Mark as New
- Bookmark
- Subscribe
- Mute
- Subscribe to RSS Feed
- Permalink
- Report Inappropriate Content
Exactly, as mentioned by pratyush, this wouldn't work if the values are not in the same pattern.
| Month | grade | range | sale |
| 1 | A | 10 to 20 | 10 |
| 1 | B | 30 to 40 | 20 |
| 1 | C | 50 to 60 | 30 |
| 2 | A | 10 to 20 | 12 |
| 2 | B | 30 to 40 | 6 |
| 2 | C | 50 to 60 | 4 |
| 3 | A | 10 to 20 | 10 |
| 3 | B | 30 to 40 | 99 |
| 3 | C | 50 to 60 | 30 |
| 4 | A | 10 to 20 | 6 |
| 4 | B | 30 to 40 | 66 |
| 4 | C | 50 to 60 | 30 |
| 5 | A | 10 to 20 | 0 |
| 5 | B | 30 to 40 | 20 |
| 5 | C | 50 to 60 | 30 |
| 6 | A | 10 to 20 | 878 |
| 6 | B | 30 to 40 | 20 |
| 6 | C | 50 to 60 | 30 |
| 7 | A | 10 to 20 | 10 |
| 7 | B | 30 to 40 | 8 |
| 7 | C | 50 to 60 | 30 |
| 8 | A | 10 to 20 | 10 |
| 8 | B | 30 to 40 | 0 |
| 8 | C | 50 to 60 | 30 |
| 9 | A | 10 to 20 | 10 |
| 9 | B | 30 to 40 | 22 |
| 9 | C | 50 to 60 | 66 |
| 10 | A | 10 to 20 | 10 |
| 10 | B | 30 to 40 | 64 |
| 10 | C | 50 to 60 | 30 |
| 11 | A | 10 to 20 | 10 |
| 11 | B | 30 to 40 | 35 |
| 11 | C | 50 to 60 | 30 |
| 12 | A | 10 to 20 | 77 |
| 12 | B | 30 to 40 | 20 |
| 12 | C | 50 to 60 | 8 |
| 1 | A | 20 to 30 | 56 |
| 1 | B | 40 to 50 | 9 |
| 1 | C | 60 to 70 | 30 |
| 2 | A | 20 to 30 | 78 |
| 2 | B | 40 to 50 | 20 |
| 2 | C | 60 to 70 | 30 |
| 3 | A | 20 to 30 | 5 |
| 3 | B | 40 to 50 | 20 |
| 3 | C | 60 to 70 | 78 |
| 4 | A | 20 to 30 | 10 |
| 4 | B | 40 to 50 | 6 |
| 4 | C | 60 to 70 | 9 |
| 5 | A | 20 to 30 | 3 |
| 5 | B | 40 to 50 | 20 |
| 5 | C | 60 to 70 | 7 |
| 6 | A | 20 to 30 | 10 |
| 6 | B | 40 to 50 | 20 |
| 6 | C | 60 to 70 | 9 |
| 7 | A | 20 to 30 | 78 |
| 7 | B | 40 to 50 | 20 |
| 7 | C | 60 to 70 | 30 |
| 8 | A | 20 to 30 | 5 |
| 8 | B | 40 to 50 | 20 |
| 8 | C | 60 to 70 | 3 |
| 9 | A | 20 to 30 | 10 |
| 9 | B | 40 to 50 | 20 |
| 9 | C | 60 to 70 | 30 |
| 10 | A | 20 to 30 | 10 |
| 10 | B | 40 to 50 | 45 |
| 10 | C | 60 to 70 | 6 |
| 11 | A | 20 to 30 | 24 |
| 11 | B | 40 to 50 | 20 |
| 11 | C | 60 to 70 | 5 |
| 12 | A | 20 to 30 | 10 |
| 12 | B | 40 to 50 | 85 |
| 12 | C | 60 to 70 | 30 |
I am getting this:
| Month | grade | sum(sale)*Month |
| 1 | A | 66 |
| 1 | B | 29 |
| 1 | C | 60 |
| 2 | A | 180 |
| 2 | B | 52 |
| 2 | C | 68 |
but I expect to see:
| Month | grade | sum(sale)*Month |
| 1 | A | 66 |
| 1 | B | 29 |
| 1 | C | 60 |
| 2 | A | 156 |
| 2 | B | 55 |
| 2 | C | 94 |
- Mark as New
- Bookmark
- Subscribe
- Mute
- Subscribe to RSS Feed
- Permalink
- Report Inappropriate Content
Hi Siva
PFA the .qvw for your desired result.
Regards
Pratyush
- Mark as New
- Bookmark
- Subscribe
- Mute
- Subscribe to RSS Feed
- Permalink
- Report Inappropriate Content
Hi Siva
Did you check my solution, is it not working for you? Please let me know if that is the case.
Regards
Pratyush
- Mark as New
- Bookmark
- Subscribe
- Mute
- Subscribe to RSS Feed
- Permalink
- Report Inappropriate Content
It's working, that is what I need. Thanks for your help Pratyush. So the logic here is to create a cross join? Could you help me understand the logic?
- « Previous Replies
-
- 1
- 2
- Next Replies »