Unlock a world of possibilities! Login now and discover the exclusive benefits awaiting you.
- Qlik Community
- :
- All Forums
- :
- QlikView App Dev
- :
- Rolling 12 months for zero values question
- Subscribe to RSS Feed
- Mark Topic as New
- Mark Topic as Read
- Float this Topic for Current User
- Bookmark
- Subscribe
- Mute
- Printer Friendly Page
- Mark as New
- Bookmark
- Subscribe
- Mute
- Subscribe to RSS Feed
- Permalink
- Report Inappropriate Content
Rolling 12 months for zero values question
Hi,
I am using the following function in a chart to calculate "Rolling 12 months" for each of the ServiceZoneCodes (see example below for Service zone 201).
This function works well in a well populated data set.
= Rangeavg( Above (count({$<Year =, Month =, %PSHOrderDate =, [PSH.ServiceZoneCode]={'SE201'}>} DISTINCT [PSH.No]),0,12))
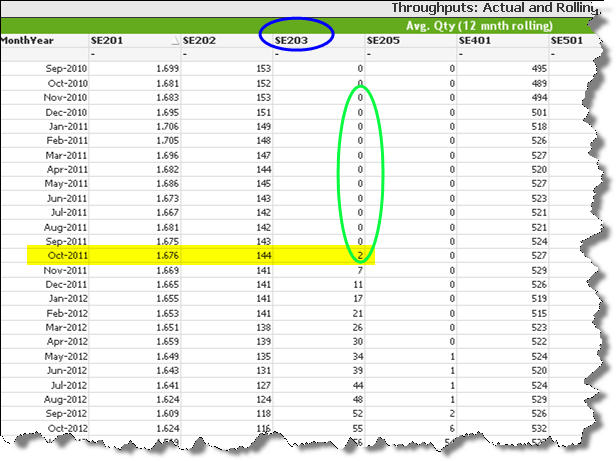
I have a scenario where a new Service Zone (see SE203 marked in GREEN below) was introduced and, unlike the other ServiceZones it does not have enough values to make up 12 values to average, so the calculated values are not representative of the true "average".
As an example the value for the first month that SE203 was introduced (Oct 2011) is 21 - here it shows "2" (see yellow highlight) because that is the average of:
(21 + 0 + 0 + 0 + 0 + 0 + 0 + 0 + 0 + 0 + 0 + 0) /12 which is rounded up to "2"
Is there a way to average the previous non-zero values only?
Your help would be highly appreciated
Alexis
- Mark as New
- Bookmark
- Subscribe
- Mute
- Subscribe to RSS Feed
- Permalink
- Report Inappropriate Content
Any ideas anyone?