Unlock a world of possibilities! Login now and discover the exclusive benefits awaiting you.
- Qlik Community
- :
- All Forums
- :
- QlikView App Dev
- :
- Rolling 12 months in Chart
- Subscribe to RSS Feed
- Mark Topic as New
- Mark Topic as Read
- Float this Topic for Current User
- Bookmark
- Subscribe
- Mute
- Printer Friendly Page
- Mark as New
- Bookmark
- Subscribe
- Mute
- Subscribe to RSS Feed
- Permalink
- Report Inappropriate Content
Rolling 12 months in Chart
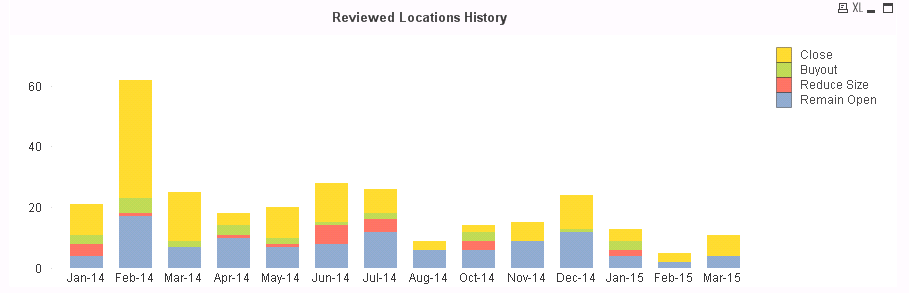
Can someone tell me how to get my chart to only display a rolling 12 month period? I have a master calendar but I can't get the set analysis to work. I'm not sure which pieces of the master calendar I should be using to come up with the rolling 12 mos. My date field is called [Month Reviewed] i.e. Mar-15 for March 2015.
Any help would be greatly appreciated
- Tags:
- 12_months_rolling
- « Previous Replies
-
- 1
- 2
- Next Replies »
Accepted Solutions
- Mark as New
- Bookmark
- Subscribe
- Mute
- Subscribe to RSS Feed
- Permalink
- Report Inappropriate Content
Change according to your FieldName from my below example...
Create below field in your script..
Date(MonthStart(TempDate),'MMM-YY') as InvoiceMonthYear,
Last 12 Months Sales From Current Month
Create a Bar Chart
Dimension
InvoiceMonthYear
Expression
=SUM({<
InvoiceDate=,InvoiceDay=,InvoiceMonth=,InvoiceQuarter=,InvoiceWeekDay=,InvoiceYear=,
InvoiceMonthYear = {">=$(=Date(MonthStart(Today(),-11),'MMM-YY'))<=$(=Date(MonthStart(Today()),'MMM-YY'))"}
>}Sales)
Last 12 Months Sales From User Selected MonthYear
Create a Bar Chart
Dimension
InvoiceMonthYear
Expression
=SUM({<
InvoiceDate=,InvoiceDay=,InvoiceMonth=,InvoiceQuarter=,InvoiceWeekDay=,InvoiceYear=,
InvoiceMonthYear = {">=$(=Date(MonthStart(Max(InvoiceMonthYear),-11),'MMM-YY'))<=$(=Date(MonthStart(Max(InvoiceMonthYear)),'MMM-YY'))"}
>}Sales)
- Mark as New
- Bookmark
- Subscribe
- Mute
- Subscribe to RSS Feed
- Permalink
- Report Inappropriate Content
Hi Bruce,
You could use Dimension limits against your date field, e.g. tick Show only = 12, un-tick show others
Regards
Andy
- Mark as New
- Bookmark
- Subscribe
- Mute
- Subscribe to RSS Feed
- Permalink
- Report Inappropriate Content
Thanks. I did that and for some reason the chart keeps Jan-14, Feb-14, and Mar-14 and drops Jan-15 and Feb-15?

- Mark as New
- Bookmark
- Subscribe
- Mute
- Subscribe to RSS Feed
- Permalink
- Report Inappropriate Content
Interesting, may be a sort order issue Sep-14 is missing 2 in both screen shots. Any chance you can post the qvw?
Andy
- Mark as New
- Bookmark
- Subscribe
- Mute
- Subscribe to RSS Feed
- Permalink
- Report Inappropriate Content
Change according to your FieldName from my below example...
Create below field in your script..
Date(MonthStart(TempDate),'MMM-YY') as InvoiceMonthYear,
Last 12 Months Sales From Current Month
Create a Bar Chart
Dimension
InvoiceMonthYear
Expression
=SUM({<
InvoiceDate=,InvoiceDay=,InvoiceMonth=,InvoiceQuarter=,InvoiceWeekDay=,InvoiceYear=,
InvoiceMonthYear = {">=$(=Date(MonthStart(Today(),-11),'MMM-YY'))<=$(=Date(MonthStart(Today()),'MMM-YY'))"}
>}Sales)
Last 12 Months Sales From User Selected MonthYear
Create a Bar Chart
Dimension
InvoiceMonthYear
Expression
=SUM({<
InvoiceDate=,InvoiceDay=,InvoiceMonth=,InvoiceQuarter=,InvoiceWeekDay=,InvoiceYear=,
InvoiceMonthYear = {">=$(=Date(MonthStart(Max(InvoiceMonthYear),-11),'MMM-YY'))<=$(=Date(MonthStart(Max(InvoiceMonthYear)),'MMM-YY'))"}
>}Sales)
- Mark as New
- Bookmark
- Subscribe
- Mute
- Subscribe to RSS Feed
- Permalink
- Report Inappropriate Content
Actually, we don't have any Sep-14 data so that's why that month is missing. And, no unfortunately I can't post the .qvw..
- Mark as New
- Bookmark
- Subscribe
- Mute
- Subscribe to RSS Feed
- Permalink
- Report Inappropriate Content
A syntax for rolling 12 month set expression is in the blog The Magic of Set Analysis – Point In Time Reporting | iQlik - Everything QlikView.
Hope this helps.
- Mark as New
- Bookmark
- Subscribe
- Mute
- Subscribe to RSS Feed
- Permalink
- Report Inappropriate Content
1. How are you sorting the axis?
2. Can you post the Calendar Script?
Andy
- Mark as New
- Bookmark
- Subscribe
- Mute
- Subscribe to RSS Feed
- Permalink
- Report Inappropriate Content
Arggh, just re read what I put earlier - total garbage! 
Instead, how a looks at the attached link which does the job properly
https://community.qlik.com/message/398262#398262
Humbly!
Andy
- Mark as New
- Bookmark
- Subscribe
- Mute
- Subscribe to RSS Feed
- Permalink
- Report Inappropriate Content
Works perfectly. Thank you so much!
- « Previous Replies
-
- 1
- 2
- Next Replies »