Unlock a world of possibilities! Login now and discover the exclusive benefits awaiting you.
- Qlik Community
- :
- All Forums
- :
- QlikView App Dev
- :
- Re: Rolling 30 Days Average via Chart
- Subscribe to RSS Feed
- Mark Topic as New
- Mark Topic as Read
- Float this Topic for Current User
- Bookmark
- Subscribe
- Mute
- Printer Friendly Page
- Mark as New
- Bookmark
- Subscribe
- Mute
- Subscribe to RSS Feed
- Permalink
- Report Inappropriate Content
Rolling 30 Days Average via Chart
Hi everyone! I've been a long time lurker of these forums. I've read a ton in the last 3 years I've been using QlikView.
I haven't been able to solve my issue via lurking (or even find something close to it), so I finally made an account. 
Here's the scenario:
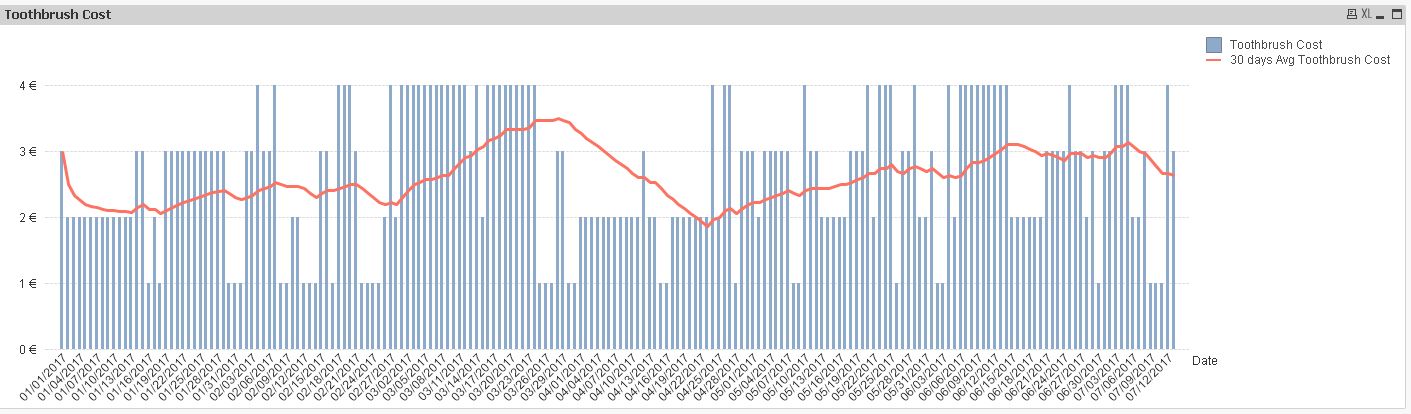
I've been asked to find the average cost of an item for the last month, but on a specific day... i.e. The average cost of a toothbrush for the last 30 days on July 12th, 2017 (so the average cost of the toothbrush between June 13th and July 12th). That part is simple.
But now here's the tricky part:
I need to be able to show this average cost across the lifespan of my data. i.e. The average cost of a toothbrush for the last 30 days on July 12th (avg of June 13th - July 12th), July 11th (avg of June 12th - July 11th), July 10th (avg of June 11th - July 10th), etc. Each average will have 30 days of cost values.
I'm not sure what to call it. A trailing 30 days average or something. On top of all this, I need to get it into a chart format of sorts - line or bar, I don't care for now. Just trying to get the concept down.
I'm not sure if it's better to get all of this in during the load of the files or using a calculated field in the expressions and/or dimensions.
Any help is appreciated!
- « Previous Replies
-
- 1
- 2
- Next Replies »
Accepted Solutions
- Mark as New
- Bookmark
- Subscribe
- Mute
- Subscribe to RSS Feed
- Permalink
- Report Inappropriate Content
Hi,
if your cost values are valid from date of occurrence until the next recorded date then one solution might be to generate the missing dates e.g. like described in "Creating Reference Dates for Intervals" using Jean-Baptiste's RangeAvg() expression.
So one example might be:
tabTemp:
LOAD Date(Date) as Date,
    Money([Toothbrush Cost],'#,##0 €;-#,##0 €') as [Toothbrush Cost]
FROM [https://community.qlik.com/servlet/JiveServlet/download/1306577-287201/QlikViewExample.xlsx] (ooxml, embedded labels, table is Sheet1)
Where Date;

NoConcatenate

tabCost:
LOAD Date(Date+IterNo()-1) as Date,
    [Toothbrush Cost]
While Date+IterNo()-1 < PrevDate or IterNo()=1;
LOAD Date,
    Previous(Date) as PrevDate,
    [Toothbrush Cost]
Resident tabTemp
Order By Date desc;

DROP Table tabTemp;
hope this helps
regards
Marco
- Mark as New
- Bookmark
- Subscribe
- Mute
- Subscribe to RSS Feed
- Permalink
- Report Inappropriate Content
Another note: What I'm looking for is very similar to the Accumulate option on the Expressions tab of a chart, but it cannot be a summation. Really looking for that average.
This guy on youtube almost nails it for me, but still missing the average part.
QlikView Tutorials | Expressions | Creating Running Total or Rolling n days total - YouTube
- Mark as New
- Bookmark
- Subscribe
- Mute
- Subscribe to RSS Feed
- Permalink
- Report Inappropriate Content
Hi, maybe in a chart try with date as dimension and as expression :
RangeAvg(above(Cost,0,30))
- Mark as New
- Bookmark
- Subscribe
- Mute
- Subscribe to RSS Feed
- Permalink
- Report Inappropriate Content
Aye! I literally just stumbled upon this exact same equation! It is so close. SO CLOSE! The value of 30 works perfectly if I have 30 days of data points, but if I have (for example) 5, it doesn't work as well.
This is good, however!
- Mark as New
- Bookmark
- Subscribe
- Mute
- Subscribe to RSS Feed
- Permalink
- Report Inappropriate Content
Ok, when you say it doesn't work as well when it's 5, it means that your data begins on 07/07/2017 ??
Maybe you have to store the number of cell in a vriable and use : RangeAvg(above(Cost,0,$(V_cell)))
- Mark as New
- Bookmark
- Subscribe
- Mute
- Subscribe to RSS Feed
- Permalink
- Report Inappropriate Content
So for example, let's say I still want to look at the 30 days prior average of the toothbrush.
RangeAvg(above(Cost,0,30)) works great if each day has ONE cost associated with it.
But I only have five data points in that 30 day range (e.g. July 11th, July 8th, June 30th, June 29th, and June 14th), the calculation goes into my other data points (June 4th, April 3rd, January 1st. etc.) The same can be said if I have multiple cost data points for a specific day.
Maybe if I were able to extract a count of how many data points are within the range of June 13th - July 12th and apply that to the RangeAvg code... Hmmmmm.
- Mark as New
- Bookmark
- Subscribe
- Mute
- Subscribe to RSS Feed
- Permalink
- Report Inappropriate Content
Ok, i understand. So, it should works for you with :
RangeSum(above(Cost,0,30)) / RangeSum(above(if(Cost='',0,1),0,30))
- Mark as New
- Bookmark
- Subscribe
- Mute
- Subscribe to RSS Feed
- Permalink
- Report Inappropriate Content
I see what you did here. You are spelling out the average by using RangeSum rather than using RangeAvg. Very smart.
Again, this is very close, but not exactly what I'm looking for. A+ work, however.
I'll keep tweaking and see what I can come up with. Other suggestions are more than welcome. 
- Mark as New
- Bookmark
- Subscribe
- Mute
- Subscribe to RSS Feed
- Permalink
- Report Inappropriate Content
Ok ,but can you provide an Excel sample file, that I can work from your data?
- Mark as New
- Bookmark
- Subscribe
- Mute
- Subscribe to RSS Feed
- Permalink
- Report Inappropriate Content
Hi Matthew,
I would do it in the script using Peek.
Something like
AggrOverDay:
Load
Date,
Sum(Qty) as DayQty,
Sum(Qty*Price) as DaySales,
.
.
From ...
Group by Date;
then
Load
.
.
Date,
Rangesum(DayQty, Peek(30DayQty),-Peek(DayQty,-30)) as 30DayQty
Rangesum(DaySales, Peek(30TotalDaySales),-Peek(DaySales,-30)) as 30TotalDaySales
.
.
From AggrOverDay;
Then the 30Avg is 30TotalDaySales / 30DayQty
I haven't been able to debug this; I'm hoping just to give you the idea.
Good luck
Andrew
- « Previous Replies
-
- 1
- 2
- Next Replies »