Unlock a world of possibilities! Login now and discover the exclusive benefits awaiting you.
- Qlik Community
- :
- All Forums
- :
- QlikView App Dev
- :
- Rolling N Period Revenues with RangeSum, Above, & ...
- Subscribe to RSS Feed
- Mark Topic as New
- Mark Topic as Read
- Float this Topic for Current User
- Bookmark
- Subscribe
- Mute
- Printer Friendly Page
- Mark as New
- Bookmark
- Subscribe
- Mute
- Subscribe to RSS Feed
- Permalink
- Report Inappropriate Content
Rolling N Period Revenues with RangeSum, Above, & AGGR
I have an app with revenues by month (lowest level of granularity). Need to calculate rolling N periods on the fly, when the chart dimension is allowed to change with a cyclic group. The cyclic group "Periods" goes through 3 levels of reporting granularity: `Year-Period` -> 'Year-Qtr` -> `Year`.
The following formula works like a charm for the most granular setting (i.e. `Year-Period`):
SUM(AGGR(
RangeSum(Above(Sum(
     {$< Year=, [Year-Qtr]=, Month= >}
[# Revenue Amount]
   ),0,$1)),
[Year-Period]
  )
 )
where $1 is set to 12 for rolling 12, 6 for rolling 6, etc.
However, whenever the chart is cycled to `Year-Qtr` or `Year`, the calculations are incorrect, as the formula will aggregate 6 years above for $1 = 6 with Year selected, etc. I've considered some sort of workarounds such as dividing the $1 value by a factor based on the value of the cyclic group dimension (using `GetCurrentField(Periods)` in a conditional formula to provide a divisor for the N value passed into the parameter). However, this seems a bit clunky and presents some problems - for instance, if we want Rolling 6 months and the user selects `Year`, we'll get 0.5 as the row count in the RangeSum expression.
I've attached a sample QVD. I've been trying to crack this Rolling N calculation a number of ways, including with an AsOf Dates table...but I keep running into a wall whenever the granularity of the chart dimension changes.
Appreciate any inputs! Thank you.
Accepted Solutions
- Mark as New
- Bookmark
- Subscribe
- Mute
- Subscribe to RSS Feed
- Permalink
- Report Inappropriate Content
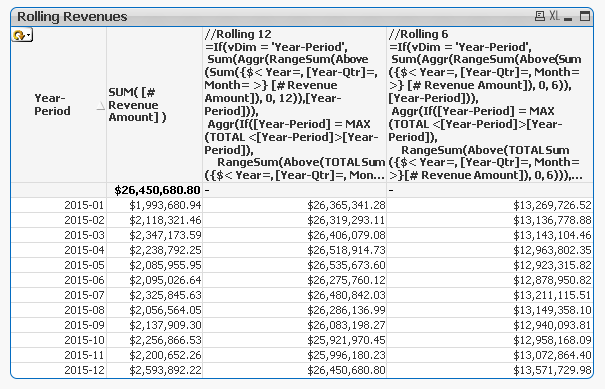
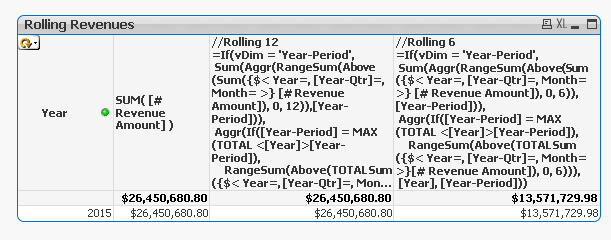
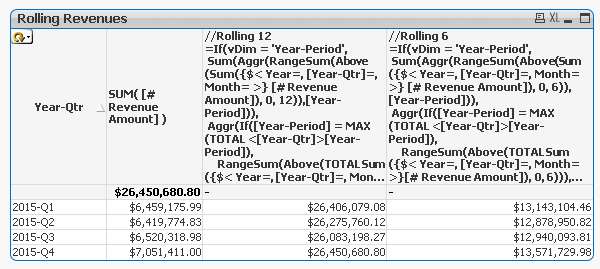
Try these two expressions out:
//Rolling 12
=If(vDim = 'Year-Period',
Sum(Aggr(RangeSum(Above(Sum({$< Year=, [Year-Qtr]=, Month= >} [# Revenue Amount]), 0, 12)),[Year-Period])),
Aggr(If([Year-Period] = MAX(TOTAL <$(=vDim)>[Year-Period]),
RangeSum(Above(TOTAL Sum({$< Year=, [Year-Qtr]=, Month= >}[# Revenue Amount]), 0, 12))),
$(=vDim), [Year-Period]))
//Rolling 6
=If(vDim = 'Year-Period',
Sum(Aggr(RangeSum(Above(Sum({$< Year=, [Year-Qtr]=, Month= >} [# Revenue Amount]), 0, 6)),[Year-Period])),
Aggr(If([Year-Period] = MAX(TOTAL <$(=vDim)>[Year-Period]),
RangeSum(Above(TOTAL Sum({$< Year=, [Year-Qtr]=, Month= >}[# Revenue Amount]), 0, 6))),
$(=vDim), [Year-Period]))
Where vDim = ='[' & GetCurrentField(Periods) & ']'
When on Year-Period:
When on Year:
When on Year-Qtr:
- Mark as New
- Bookmark
- Subscribe
- Mute
- Subscribe to RSS Feed
- Permalink
- Report Inappropriate Content
What is the output that you are hoping to see?
- Mark as New
- Bookmark
- Subscribe
- Mute
- Subscribe to RSS Feed
- Permalink
- Report Inappropriate Content
I want the formula to return the correct rolling N-period amount regardless of what dimension the user selects. If it's a rolling 6-month, then I want it to show the sum of the prior 6 months of revenue as of the dimension date. If the user has selected Year in the cyclic dimension, then the chart should show rolling 6 months as of the end of the year (i.e. 12/31/20XX). If the user selects Year-Quarter in the cyclic dimension, the chart would show the sum of revenues for the past six months - i.e. sum of the current and prior quarters for each dimension value.
Does that make sense?
- Mark as New
- Bookmark
- Subscribe
- Mute
- Subscribe to RSS Feed
- Permalink
- Report Inappropriate Content
Try these two expressions out:
//Rolling 12
=If(vDim = 'Year-Period',
Sum(Aggr(RangeSum(Above(Sum({$< Year=, [Year-Qtr]=, Month= >} [# Revenue Amount]), 0, 12)),[Year-Period])),
Aggr(If([Year-Period] = MAX(TOTAL <$(=vDim)>[Year-Period]),
RangeSum(Above(TOTAL Sum({$< Year=, [Year-Qtr]=, Month= >}[# Revenue Amount]), 0, 12))),
$(=vDim), [Year-Period]))
//Rolling 6
=If(vDim = 'Year-Period',
Sum(Aggr(RangeSum(Above(Sum({$< Year=, [Year-Qtr]=, Month= >} [# Revenue Amount]), 0, 6)),[Year-Period])),
Aggr(If([Year-Period] = MAX(TOTAL <$(=vDim)>[Year-Period]),
RangeSum(Above(TOTAL Sum({$< Year=, [Year-Qtr]=, Month= >}[# Revenue Amount]), 0, 6))),
$(=vDim), [Year-Period]))
Where vDim = ='[' & GetCurrentField(Periods) & ']'
When on Year-Period:
When on Year:
When on Year-Qtr: