Unlock a world of possibilities! Login now and discover the exclusive benefits awaiting you.
- Qlik Community
- :
- All Forums
- :
- QlikView App Dev
- :
- Re: Re: Re: Running Total Calculation
- Subscribe to RSS Feed
- Mark Topic as New
- Mark Topic as Read
- Float this Topic for Current User
- Bookmark
- Subscribe
- Mute
- Printer Friendly Page
- Mark as New
- Bookmark
- Subscribe
- Mute
- Subscribe to RSS Feed
- Permalink
- Report Inappropriate Content
Running Total Calculation
I need to calculate a running total in my script. My data set looks like the first 3 columns of this table:
| Location | Date | Revenue | Running Total |
| A | Jan-13 | $ 1,000 | $ 1,000 |
| A | Feb-13 | $ 1,100 | $ 2,100 |
| A | Mar-13 | $ 1,200 | $ 3,300 |
| A | Apr-13 | $ 1,300 | $ 4,600 |
| B | Jan-13 | $ 1,400 | $ 1,400 |
| B | Feb-13 | $ 1,500 | $ 2,900 |
| B | Mar-13 | $ 1,600 | $ 4,500 |
| B | Apr-13 | $ 1,700 | $ 6,200 |
| C | Jan-13 | $ 1,800 | $ 1,800 |
| C | Feb-13 | $ 1,900 | $ 3,700 |
| C | Mar-13 | $ 2,000 | $ 5,700 |
| C | Apr-13 | $ 2,100 | $ 7,800 |
I want to calculate the fourth column - a running total of Revenue grouped by column 'Location'. Any ideas ? I'm going to be using this in a pivot table on the front end.
- « Previous Replies
-
- 1
- 2
- Next Replies »
- Mark as New
- Bookmark
- Subscribe
- Mute
- Subscribe to RSS Feed
- Permalink
- Report Inappropriate Content
Worked like a charm, thanks !
- Mark as New
- Bookmark
- Subscribe
- Mute
- Subscribe to RSS Feed
- Permalink
- Report Inappropriate Content
Hi Marco:
I am a beginner and using the QV Personal Edition for now. I cannot view your .qvw and while I have put your suggestion into my Straight Table expression as per the following, I am not quite getting the results you have shown. Also the format that you have achieved with your approach is something I would like to get. I refer here to the date sequence as well as to the suppression of duplicates in the Inv#. I must be missing something somewhere. If you would be good enough to elaborate on your strategy it would be most appreciated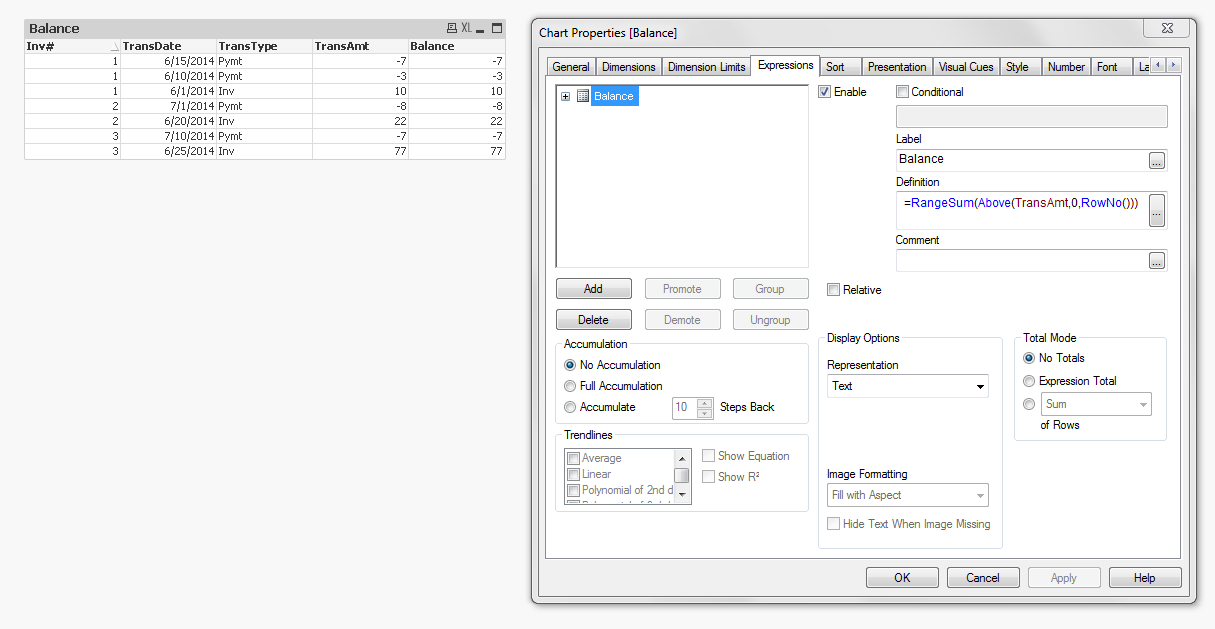
And thanks. It is very satisfying to see how the QlikView Community responds.
David
- Mark as New
- Bookmark
- Subscribe
- Mute
- Subscribe to RSS Feed
- Permalink
- Report Inappropriate Content
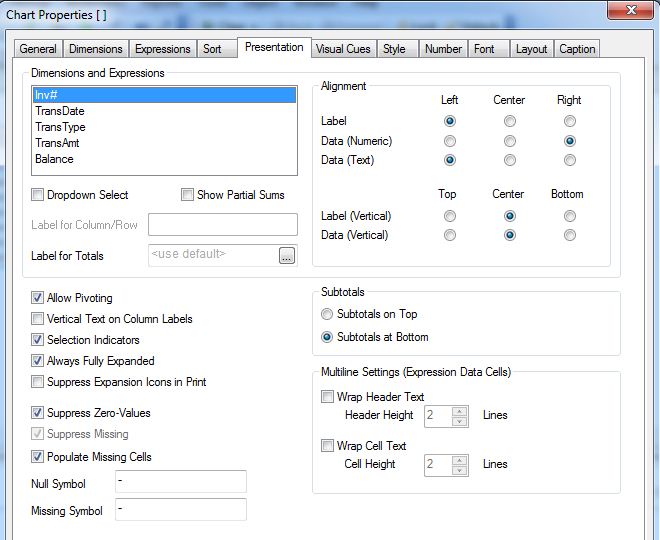
Hi David,
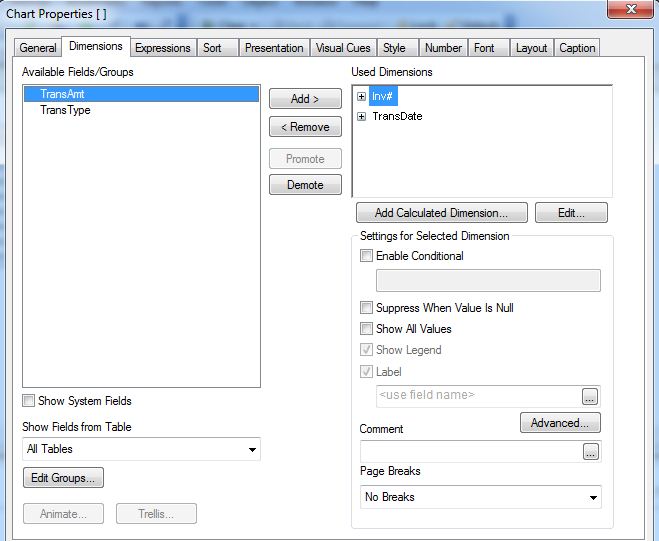
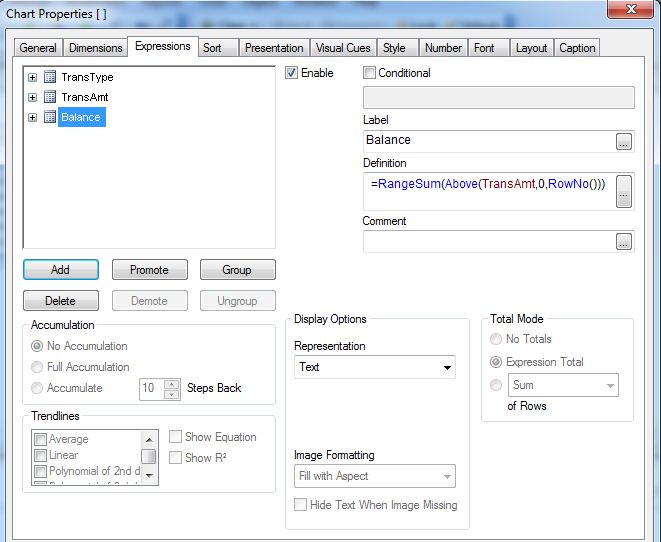
hope these screenshots and this script might help you recreate the solution:
tab1:
LOAD Inv#,
TransDate,
TransType,
TransAmt
FROM
(ooxml, embedded labels, table is Tabelle1);
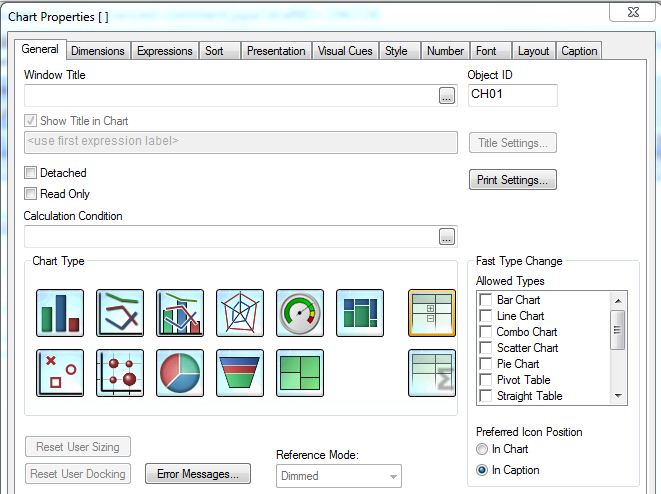
pivot table !
regards
Marco
- Mark as New
- Bookmark
- Subscribe
- Mute
- Subscribe to RSS Feed
- Permalink
- Report Inappropriate Content
Hi Marco
And thank you. I was just missing the sum(TransAmt) for the 2nd Expression. Works fine now and really helped a lot.
Regards
David
- « Previous Replies
-
- 1
- 2
- Next Replies »