Unlock a world of possibilities! Login now and discover the exclusive benefits awaiting you.
- Qlik Community
- :
- All Forums
- :
- QlikView App Dev
- :
- SET analysis with substringcount and concat
- Subscribe to RSS Feed
- Mark Topic as New
- Mark Topic as Read
- Float this Topic for Current User
- Bookmark
- Subscribe
- Mute
- Printer Friendly Page
- Mark as New
- Bookmark
- Subscribe
- Mute
- Subscribe to RSS Feed
- Permalink
- Report Inappropriate Content
SET analysis with substringcount and concat
I have a chart w/ 4 dimensions and 7 expressions: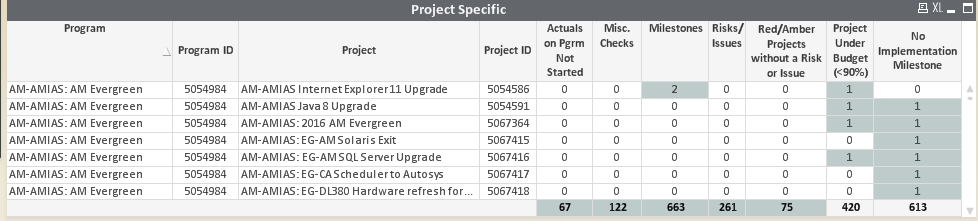
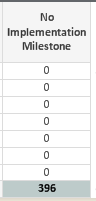
My expression all the way to the right ("no implementation milestone") is supposed to count projects (by ID) that do not have an implementation milestone (there are multiple milestones per project and an implementation milestone would be marked "yes" in the "TaskImpMilestone" field). Also-- I only want to count projects with a status of "Started" and a taxonomy of "Investment".
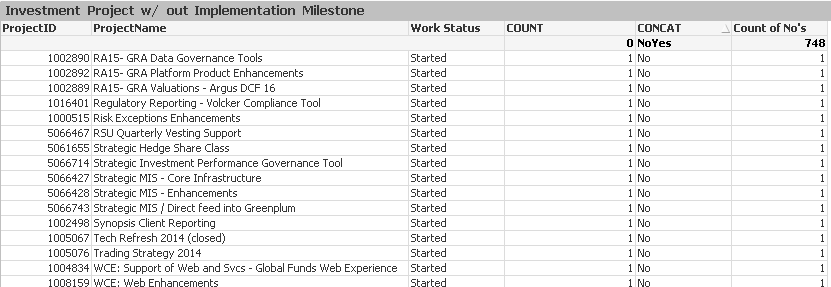
I was able to identify those projects in a separate chart by concatenating the TaskImpMilestone field and counting everything that did not have "Yes" in the string.. Now when I try to add the same set analysis below to the chart pictured above it is counting projects from all taxonomies and statuses other than "Investment" and "Started"..
=If(SubStringCount(concat({<ProjectTaxonomy={'Investment'},ProjectWorkStatus={'Started'}>} DISTINCT TaskImpMilestone),'Yes')=1,0,1)
Anyone have any ideas?
Thanks
- Mark as New
- Bookmark
- Subscribe
- Mute
- Subscribe to RSS Feed
- Permalink
- Report Inappropriate Content
Hi Julian,
Try:
Count({$<ProjectTaxonomy={'Investment'},ProjectWorkStatus={'Started'}, TaskImpMilestone ={"<> 'yes'"}>}ProgramID)
Good Luck
Andrew
PS In the bracket {"<> 'yes'"} make sure the case of 'yes' is correct. I can't remember if this is case sensitive. In your question it wasn't quite clear if this field was marked as 'yes' or 'Yes'.
- Mark as New
- Bookmark
- Subscribe
- Mute
- Subscribe to RSS Feed
- Permalink
- Report Inappropriate Content
Or
Count({$<ProjectTaxonomy={'Investment'},ProjectWorkStatus={'Started'}, TaskImpMilestone =-{'yes'}>}[Project ID])
(please note the - before {'yes'} )
EDIT: Changed ProgramID to [Project ID]
- Mark as New
- Bookmark
- Subscribe
- Mute
- Subscribe to RSS Feed
- Permalink
- Report Inappropriate Content
Neither of those returned any records for me.. I don't think those would work anyways because it's not just the ones that <> 'Yes' that I'm looking for.. some projects would have nulls as they do not have any milestones at all...
- Mark as New
- Bookmark
- Subscribe
- Mute
- Subscribe to RSS Feed
- Permalink
- Report Inappropriate Content
How about this:
Count({$<ProjectTaxonomy={'Investment'}, ProjectWorkStatus={'Started'}, ProgramID = e({<TaskImpMilestone ={'Yes'}>})>} ProgramID)
- Mark as New
- Bookmark
- Subscribe
- Mute
- Subscribe to RSS Feed
- Permalink
- Report Inappropriate Content
Sunny-- This got me a little closer but my total is still off..
My other table that I'm using to compare has 748..
Thanks,
Julian
- Mark as New
- Bookmark
- Subscribe
- Mute
- Subscribe to RSS Feed
- Permalink
- Report Inappropriate Content
Maybe something like
Count(
{$<ProjectTaxonomy={'Investment'}, ProjectWorkStatus={'Started'},
[Project ID] = e({<TaskImpMilestone ={'Yes'}>}) >}
DISTINCT [Project ID])
But with set analysis, it's vital that we know how the fields that are used in the set analysis are related to each other and what the possible value range of these sets are.
If nothing of above really works out, it's much more easy to help if you can post a small sample QVW.
I can't really see why your expression you are using successfully in your one table shouldn't work in the other as well, so I think we are missing the full picture here.
- Mark as New
- Bookmark
- Subscribe
- Mute
- Subscribe to RSS Feed
- Permalink
- Report Inappropriate Content
That one seems to have worked.. the counts match.
Thanks!