Unlock a world of possibilities! Login now and discover the exclusive benefits awaiting you.
- Qlik Community
- :
- All Forums
- :
- QlikView App Dev
- :
- SUM values on chart for Years and Months based on ...
- Subscribe to RSS Feed
- Mark Topic as New
- Mark Topic as Read
- Float this Topic for Current User
- Bookmark
- Subscribe
- Mute
- Printer Friendly Page
- Mark as New
- Bookmark
- Subscribe
- Mute
- Subscribe to RSS Feed
- Permalink
- Report Inappropriate Content
SUM values on chart for Years and Months based on calculated dimensions
Hi,
I need to create a graph like the one that is showed in the image below:
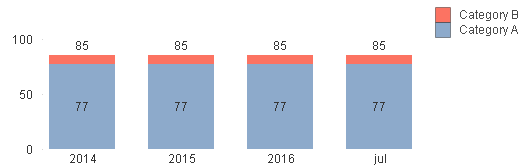
On the graph I have the following calculated dimension which give me the last 3 years and the current month.
=ValueList($(=$(vMaxYearSelected)-2), $(=$(vMaxYearSelected)-1), vMaxYearSelected, vMaxMonthSelected)
The variables that I'm using has the expressions:
Max Date Selected (vMaxDateSelected): =MAX({$} Date)
Max Year Selected (vMaxYearSelected): =Year(MAX({$} Date))
Max Month Selected (vMaxMonthSelected): =Month(MAX({$<Year={$(vMaxYearSelected)}>} Date))
Now I working on the chart expression to SUM the values of each category by year and for the last month, like showed on the image above. Following there is the expression that I'm trying to implement, but without sucess:
=Pick( Match( ValueList( $(=$(vMaxYearSelected)-2), $(=$(vMaxYearSelected)-1),vMaxYearSelected,vMaxMonthSelected), $(=$(vMaxYearSelected)-2), $(=$(vMaxYearSelected)-1), $(vMaxYearSelected), vMaxMonthSelected),
SUM({$< Year={$(=$(vMaxYearSelected)-2)}, Year={$(=$(vMaxYearSelected)-1)}, MesInicio={$(vMaxMonthSelectedh)} >} NrCategories)
However, after many retries I'm not able to get this working and get the correct results.
Could anyone help me here, please?
Many Thanks,
Paulo
Accepted Solutions
- Mark as New
- Bookmark
- Subscribe
- Mute
- Subscribe to RSS Feed
- Permalink
- Report Inappropriate Content
Is this what you want?
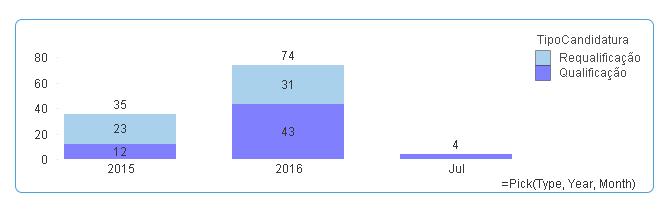
Dimensions:
=Pick(Type, Year, Month)
TipoCandidatura
Expression:
=Pick(Only({1}Type),
Sum({$<DateType={'Category'}, TipoCandidatura={'Qualificação', 'Requalificação'}, Year = {"$(='>=' & (Max(Year)-2) & '<=' & Max(Year))"}>}NrCandidaturasEntradas),
Sum({$<DateType={'Category'}, TipoCandidatura={'Qualificação', 'Requalificação'}, Month = {"$(=MaxString({<Year = {$(=Max(Year))}>}Month))"}>}NrCandidaturasEntradas))
- Mark as New
- Bookmark
- Subscribe
- Mute
- Subscribe to RSS Feed
- Permalink
- Report Inappropriate Content
Would you be able to share the sample file that you have been working on? It might be easier to provide a solution by looking at what you already have.
Best,
Sunny
- Mark as New
- Bookmark
- Subscribe
- Mute
- Subscribe to RSS Feed
- Permalink
- Report Inappropriate Content
Hi Sunny,
Please find the Qv sample attached.
I have been trying to solve this issue and I change a bit the SUM expressions, however the base was the ones that I put first.
Many thanks
Paulo
- Mark as New
- Bookmark
- Subscribe
- Mute
- Subscribe to RSS Feed
- Permalink
- Report Inappropriate Content
Hello Sunny,
Any clue on this subject?
Do you need anything else that could help achieve a solution?
Thanks
Paulo
- Mark as New
- Bookmark
- Subscribe
- Mute
- Subscribe to RSS Feed
- Permalink
- Report Inappropriate Content
Not yet, I am not sure what the desired result needs to be. Can you provide how the output needs to look like?
- Mark as New
- Bookmark
- Subscribe
- Mute
- Subscribe to RSS Feed
- Permalink
- Report Inappropriate Content
Hi,
The desired output is a chart like the above image with the sum by year and by the last month. I'm using a calculated dimension and my issue is in the expression to sum the values by year. I've placed in the attached qvw doc with what I have so far.
Thanks
Paulo
- Mark as New
- Bookmark
- Subscribe
- Mute
- Subscribe to RSS Feed
- Permalink
- Report Inappropriate Content
Is this what you want?
Dimensions:
=Pick(Type, Year, Month)
TipoCandidatura
Expression:
=Pick(Only({1}Type),
Sum({$<DateType={'Category'}, TipoCandidatura={'Qualificação', 'Requalificação'}, Year = {"$(='>=' & (Max(Year)-2) & '<=' & Max(Year))"}>}NrCandidaturasEntradas),
Sum({$<DateType={'Category'}, TipoCandidatura={'Qualificação', 'Requalificação'}, Month = {"$(=MaxString({<Year = {$(=Max(Year))}>}Month))"}>}NrCandidaturasEntradas))
- Mark as New
- Bookmark
- Subscribe
- Mute
- Subscribe to RSS Feed
- Permalink
- Report Inappropriate Content
Hi Sunny,
Great!
That's exactly what I looking for.
Many thanks for your help.
Regards
Paulo
- Mark as New
- Bookmark
- Subscribe
- Mute
- Subscribe to RSS Feed
- Permalink
- Report Inappropriate Content
No problem at all. I am glad I was able to finally help you resolve it.
Best,
Sunny