Unlock a world of possibilities! Login now and discover the exclusive benefits awaiting you.
- Qlik Community
- :
- All Forums
- :
- QlikView App Dev
- :
- Scatter chart - Y axis in percentual points (pt)
- Subscribe to RSS Feed
- Mark Topic as New
- Mark Topic as Read
- Float this Topic for Current User
- Bookmark
- Subscribe
- Mute
- Printer Friendly Page
- Mark as New
- Bookmark
- Subscribe
- Mute
- Subscribe to RSS Feed
- Permalink
- Report Inappropriate Content
Scatter chart - Y axis in percentual points (pt)
Hello,
I have a Stter chart showing market share (in %) in the x axis and market share year over year growth (in percentual points, pt) in the y axis.
The question is that while in the x axis the numbers are showed as 10%, 20%,... (which is ok) in the y axis the numbers are showed as 10, 20,... but I'm missing the 'pt' characters next to the number.
Do you know how to do that ?
thanks !
dani
- Tags:
- new_to_qlikview
- Mark as New
- Bookmark
- Subscribe
- Mute
- Subscribe to RSS Feed
- Permalink
- Report Inappropriate Content
tab number in chart properties.
you can define the Symbol there.
- Mark as New
- Bookmark
- Subscribe
- Mute
- Subscribe to RSS Feed
- Permalink
- Report Inappropriate Content
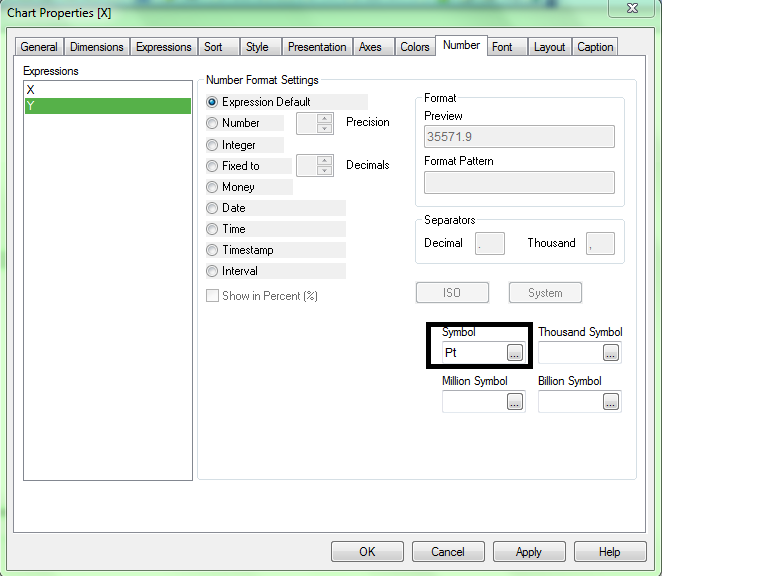
Note Pt wont be displayed next to each number on the Y axis but just on the top of the axis.
- Mark as New
- Bookmark
- Subscribe
- Mute
- Subscribe to RSS Feed
- Permalink
- Report Inappropriate Content
You could also format the Y axis (in the same view that Ajay points out) to Integer and then check the "Show in Percent (%)" box.
-Mark