Unlock a world of possibilities! Login now and discover the exclusive benefits awaiting you.
- Qlik Community
- :
- All Forums
- :
- QlikView App Dev
- :
- Scatter chart - expression's values don't show
- Subscribe to RSS Feed
- Mark Topic as New
- Mark Topic as Read
- Float this Topic for Current User
- Bookmark
- Subscribe
- Mute
- Printer Friendly Page
- Mark as New
- Bookmark
- Subscribe
- Mute
- Subscribe to RSS Feed
- Permalink
- Report Inappropriate Content
Scatter chart - expression's values don't show
Hello everyone,
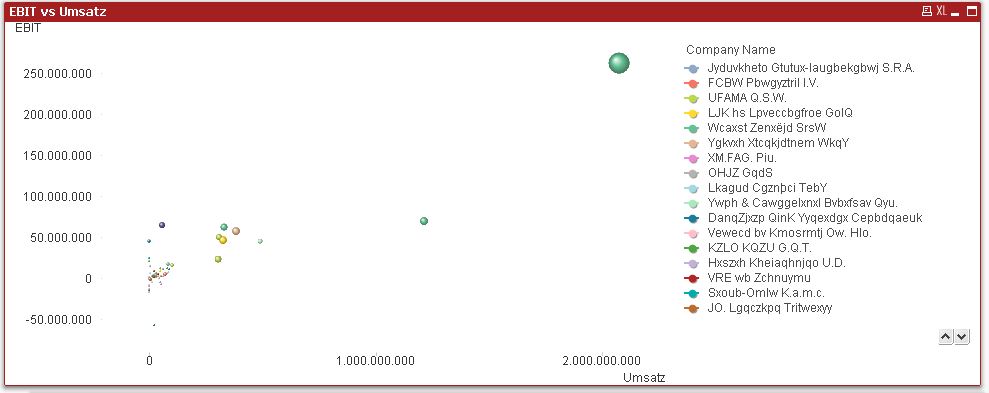
I am using scatter charts to compare certain KPIs for companies with each other.
This works well in some cases:
But for a certain expression, the chart doesn't display any values:
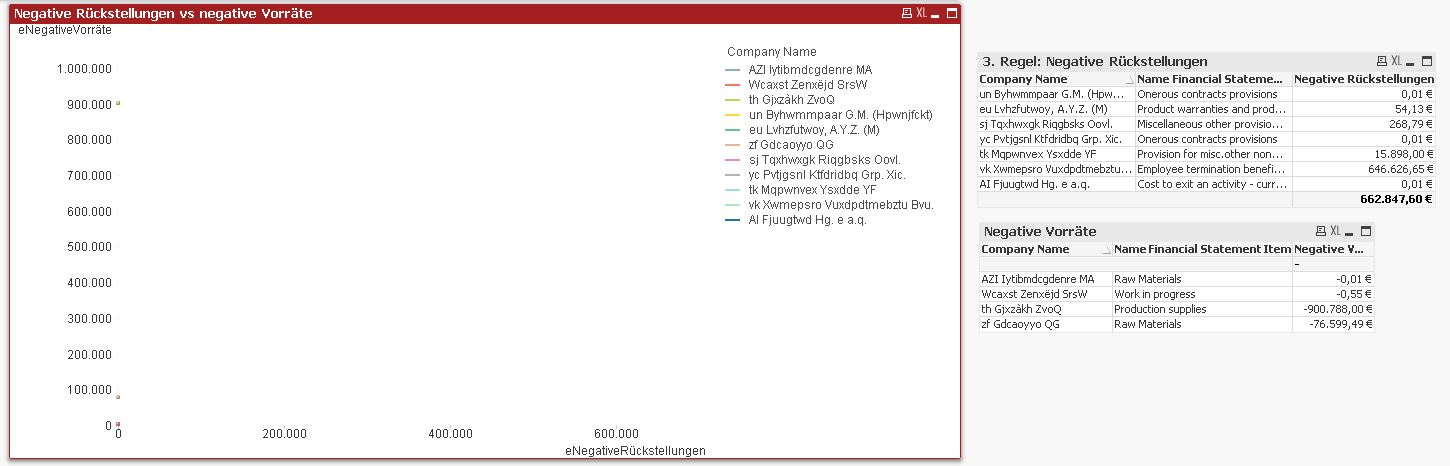
As you can see, the expression generates rows in the straight table on the right. The scatter charts even lists the affected companies in the legend but the values are not displayed in the scatter chart itself.
I think it might have something to do with the used dimensions.
Maybe someone could take a look at it, I will attach the sample.
Thank you in advance!
Best regards,
Mats
- « Previous Replies
-
- 1
- 2
- Next Replies »
- Mark as New
- Bookmark
- Subscribe
- Mute
- Subscribe to RSS Feed
- Permalink
- Report Inappropriate Content
Alt function will give the first non-null values... so when $(eNegativeVorräte)*(-1) was null, it gave 0
- « Previous Replies
-
- 1
- 2
- Next Replies »