Unlock a world of possibilities! Login now and discover the exclusive benefits awaiting you.
- Qlik Community
- :
- All Forums
- :
- QlikView App Dev
- :
- Scatter chart - expression's values don't show
- Subscribe to RSS Feed
- Mark Topic as New
- Mark Topic as Read
- Float this Topic for Current User
- Bookmark
- Subscribe
- Mute
- Printer Friendly Page
- Mark as New
- Bookmark
- Subscribe
- Mute
- Subscribe to RSS Feed
- Permalink
- Report Inappropriate Content
Scatter chart - expression's values don't show
Hello everyone,
I am using scatter charts to compare certain KPIs for companies with each other.
This works well in some cases:
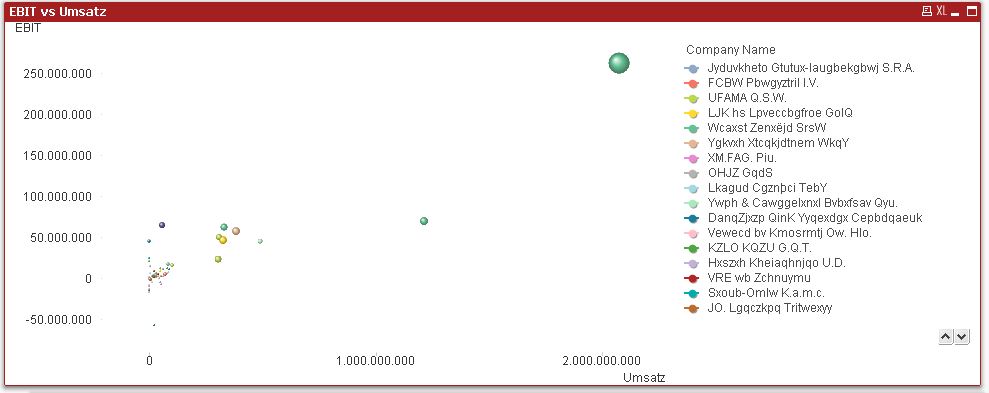
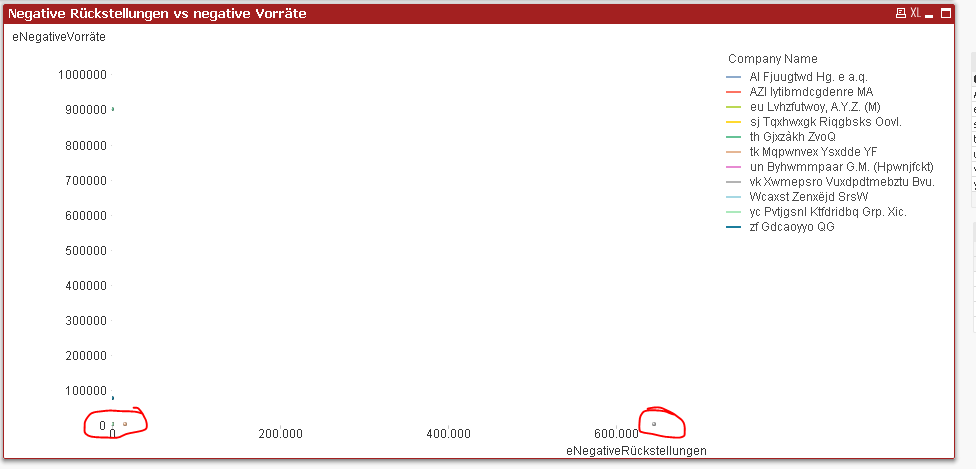
But for a certain expression, the chart doesn't display any values:
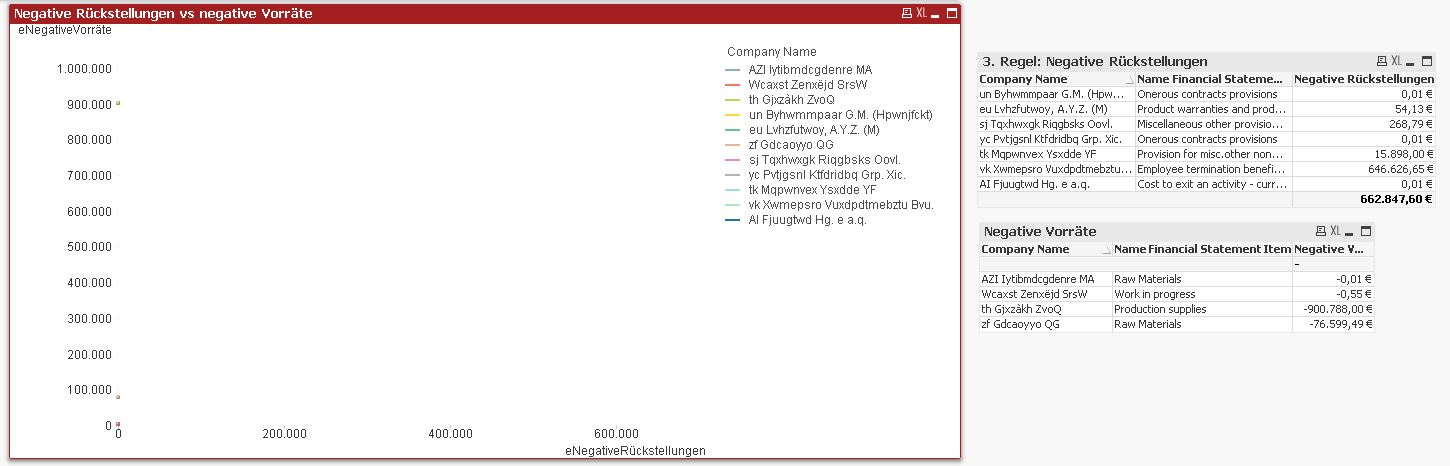
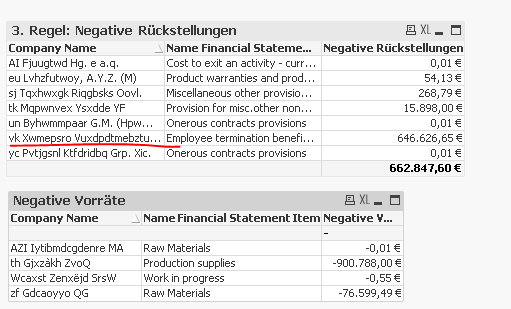
As you can see, the expression generates rows in the straight table on the right. The scatter charts even lists the affected companies in the legend but the values are not displayed in the scatter chart itself.
I think it might have something to do with the used dimensions.
Maybe someone could take a look at it, I will attach the sample.
Thank you in advance!
Best regards,
Mats
- « Previous Replies
-
- 1
- 2
- Next Replies »
Accepted Solutions
- Mark as New
- Bookmark
- Subscribe
- Mute
- Subscribe to RSS Feed
- Permalink
- Report Inappropriate Content
- Mark as New
- Bookmark
- Subscribe
- Mute
- Subscribe to RSS Feed
- Permalink
- Report Inappropriate Content
These guys are here, but seems they are very small and really scattered
- Mark as New
- Bookmark
- Subscribe
- Mute
- Subscribe to RSS Feed
- Permalink
- Report Inappropriate Content
Hi you can probably increase the size of the bubble simply by going to presentation tab>uncheck autosize symbols, then increase max bubble size point to required size
- Mark as New
- Bookmark
- Subscribe
- Mute
- Subscribe to RSS Feed
- Permalink
- Report Inappropriate Content
you can select the company names via mouse cursor in the legend and then QV zoomes into to the remaining datasets automatically...
- Mark as New
- Bookmark
- Subscribe
- Mute
- Subscribe to RSS Feed
- Permalink
- Report Inappropriate Content
Hi again Sunny,
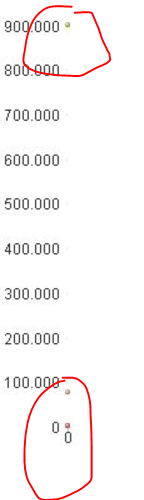
the bubbles on the Y-axis couldn't hide from my watchful eyes!
I expected similar bubbles on the X-axis though, for the other expression (highest value about 626,000)
Or is that not how the chart works?
None of the companies have positive values in both expressions, maybe that's the problem
- Mark as New
- Bookmark
- Subscribe
- Mute
- Subscribe to RSS Feed
- Permalink
- Report Inappropriate Content
But the guy with 600k value doesn't seem to have any eNegativeVorräte value
Does it just have 0 value and that is why it doesn't show up?
- Mark as New
- Bookmark
- Subscribe
- Mute
- Subscribe to RSS Feed
- Permalink
- Report Inappropriate Content
yes that's right, does a scatter chart only produce a bubble if the 'guy' has a value in the first used expression?
then it might just not be the right tool for this particular comparison
- Mark as New
- Bookmark
- Subscribe
- Mute
- Subscribe to RSS Feed
- Permalink
- Report Inappropriate Content
Hi Robin,
When I select a company that (only) has a value in eNegativeRückstelkungen, the result is 'no data to display'.
I think the chart might not be suitable when the companies don't have values for both of the expressions at the same time
- Mark as New
- Bookmark
- Subscribe
- Mute
- Subscribe to RSS Feed
- Permalink
- Report Inappropriate Content
Using this expression
Alt($(eNegativeVorräte)*(-1), 0)
It shows up
- Mark as New
- Bookmark
- Subscribe
- Mute
- Subscribe to RSS Feed
- Permalink
- Report Inappropriate Content
Ha, interesting! Didn't know about the alt function. That's what I wanted to display, thanks a lot.
- « Previous Replies
-
- 1
- 2
- Next Replies »