Unlock a world of possibilities! Login now and discover the exclusive benefits awaiting you.
- Qlik Community
- :
- All Forums
- :
- QlikView App Dev
- :
- Re: Script Issue / Graph
- Subscribe to RSS Feed
- Mark Topic as New
- Mark Topic as Read
- Float this Topic for Current User
- Bookmark
- Subscribe
- Mute
- Printer Friendly Page
- Mark as New
- Bookmark
- Subscribe
- Mute
- Subscribe to RSS Feed
- Permalink
- Report Inappropriate Content
Script Issue / Graph
Hi Guys,
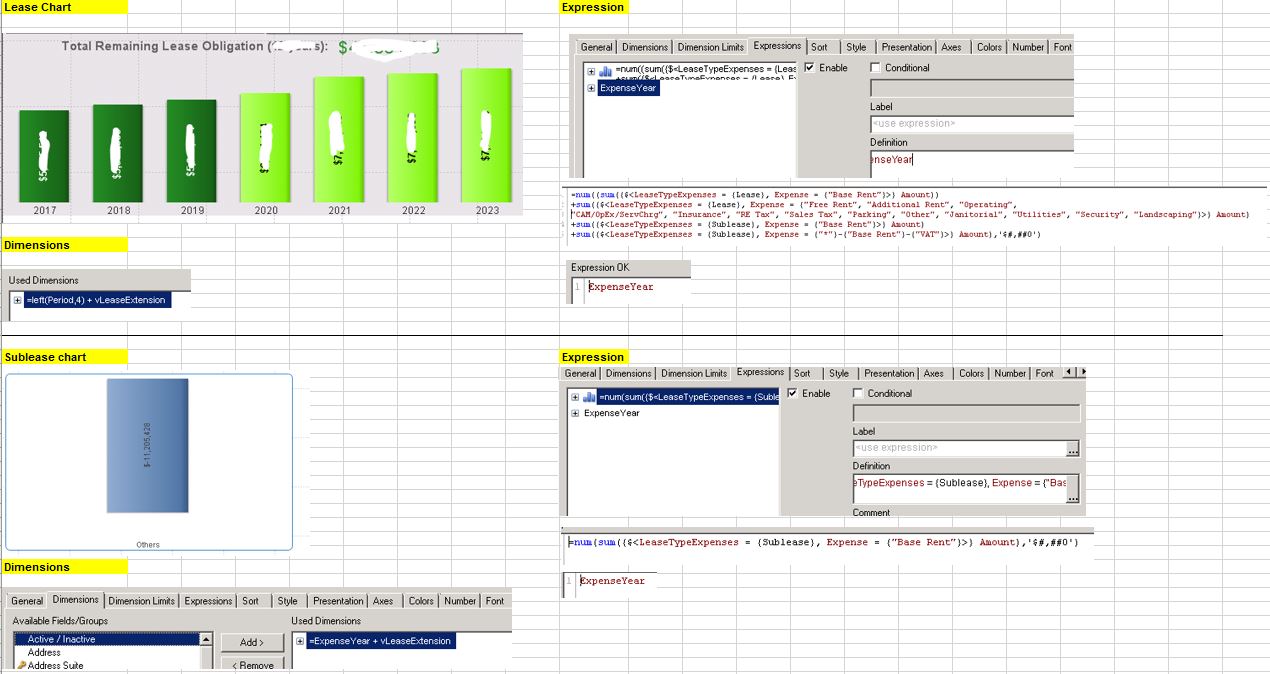
I am trying to create a grouped stacked chart and am running into an issue that I hope is a simple fix.
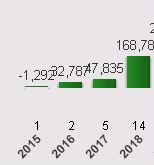
So I have managed to a chart that presents my current "Leases"; however I want to create another one that presents my "Sublease". When I create the sublease chart and follow the same formulas, the system doesn't break out the "Sublease by year and amount as displayed in the "Lease Chart", instead it consolidates the "Sublease Expense" and categorizes it under the year called "Other" ?
While I am unable to upload the actual file as it's company property, I was able to attach the details to be able to assist in helping me resolve this.
Accepted Solutions
- Mark as New
- Bookmark
- Subscribe
- Mute
- Subscribe to RSS Feed
- Permalink
- Report Inappropriate Content
Hi Alen,
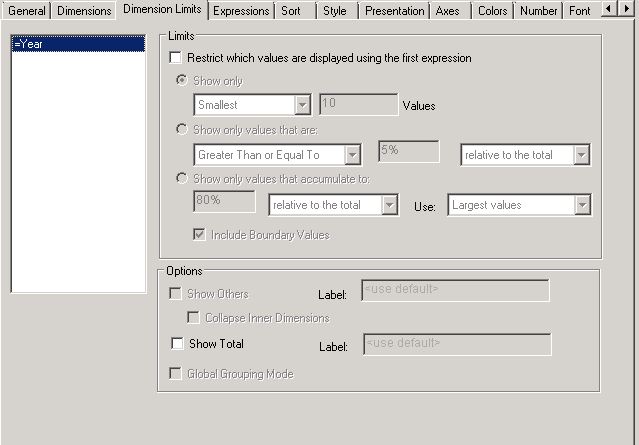
That's weird. It seems like you copied the same chart(Lease) and you just updated the expression to pull the sublease. If you did that, make sure you do not have any option checked off in the Dimensions Limits tab.
Hope that helps,
Carlos
- Mark as New
- Bookmark
- Subscribe
- Mute
- Subscribe to RSS Feed
- Permalink
- Report Inappropriate Content
Hi Alen,
That's weird. It seems like you copied the same chart(Lease) and you just updated the expression to pull the sublease. If you did that, make sure you do not have any option checked off in the Dimensions Limits tab.
Hope that helps,
Carlos
- Mark as New
- Bookmark
- Subscribe
- Mute
- Subscribe to RSS Feed
- Permalink
- Report Inappropriate Content
Thanks Carlos but none of the dimension limits are checked.
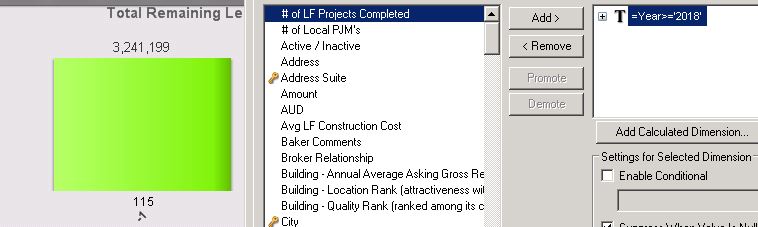
It actually crashes my data when I modify the formula to Year>='2018'