Unlock a world of possibilities! Login now and discover the exclusive benefits awaiting you.
- Qlik Community
- :
- All Forums
- :
- QlikView App Dev
- :
- Script logic
- Subscribe to RSS Feed
- Mark Topic as New
- Mark Topic as Read
- Float this Topic for Current User
- Bookmark
- Subscribe
- Mute
- Printer Friendly Page
- Mark as New
- Bookmark
- Subscribe
- Mute
- Subscribe to RSS Feed
- Permalink
- Report Inappropriate Content
Script logic
Hi Experties
Please find the attachment of QVW file and csv file .
I am trying to show a bar graph for release by hours .
Hear i need to show only those whose status is completed or accepted .
Everything is working fine ..
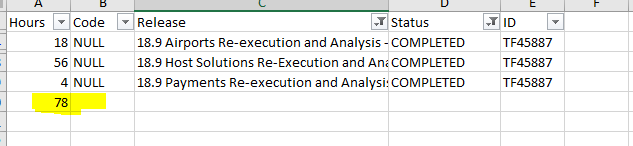
But if you observer the release number R-18.9 is showing 78 hours ..which actually should not be displayed .
My requirement is like if any release number has a status other than completed or accepted it should not be displayed in the bar graph .
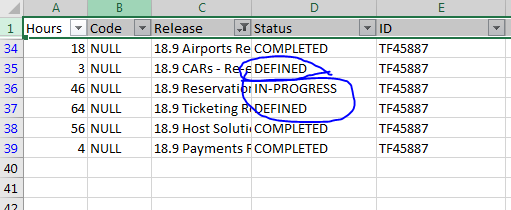
if you refer the Excel file ...and filter it by 18.9 data under status i have the status defined and in progress in such case the r-18.9 release should not be shown.
as shown in the below scrceen shot the release 18.9 has a status of defined and in progress
Therefore this release should be neglected
only i need to show the releases which has complete status either accepted or completed .
how can i handle this at the script level ?
Please some one help me on this .....
Thanks in advance
- Mark as New
- Bookmark
- Subscribe
- Mute
- Subscribe to RSS Feed
- Permalink
- Report Inappropriate Content
Hi john,
Your data looks correct and there is no issues in the bar chart as well.
For R 18.9 i can see 78 hours under status COMPLETED"
KC
- Mark as New
- Bookmark
- Subscribe
- Mute
- Subscribe to RSS Feed
- Permalink
- Report Inappropriate Content
Maybe:
Add a new field in your table:
subfield(Release,' ',1) as ReleaseNumber.
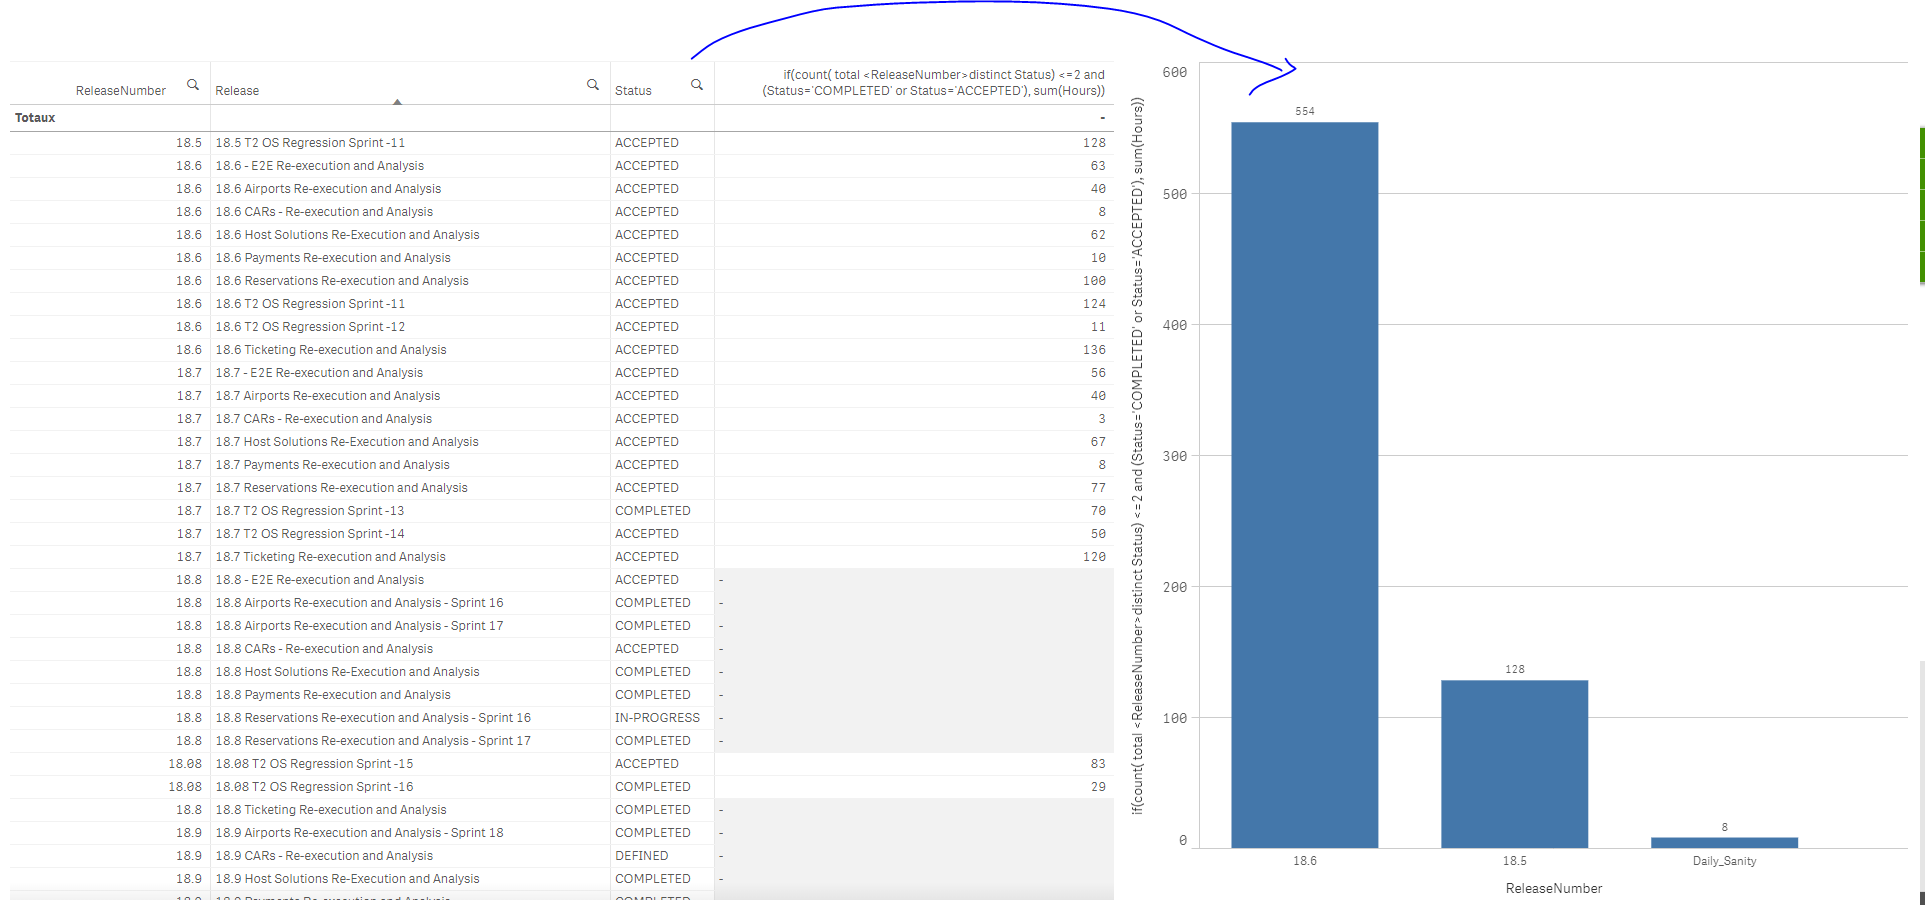
Than, use this expression:
if(count( total <ReleaseNumber>distinct Status) <=2 and (Status='COMPLETED' or Status='ACCEPTED'), sum(Hours))
Result: