Unlock a world of possibilities! Login now and discover the exclusive benefits awaiting you.
- Qlik Community
- :
- All Forums
- :
- QlikView App Dev
- :
- Separate values
- Subscribe to RSS Feed
- Mark Topic as New
- Mark Topic as Read
- Float this Topic for Current User
- Bookmark
- Subscribe
- Mute
- Printer Friendly Page
- Mark as New
- Bookmark
- Subscribe
- Mute
- Subscribe to RSS Feed
- Permalink
- Report Inappropriate Content
Separate values
Hi community,
I have a problem with a chart when I must show values separated in reviews.
Depending of Cheks of "Selector Anual", must show a specific values, but now show accumulated values.
Expected output for each Review (revision):
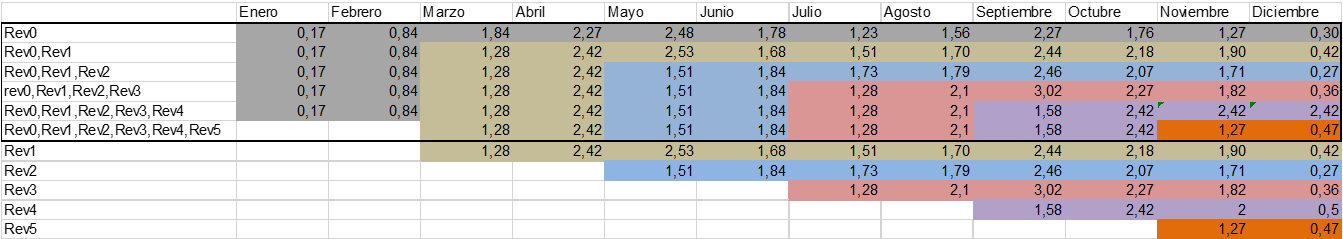
For example, if check Rev0 and Rev1, must show the next values:
Enero: 0.17
Febrero: 0.84
Marzo: 1.28
Abril: 2.42
Mayo: 2.53
Junio: 1.68
Julio: 1.51
Agosto: 1.70
Septiembre: 2.44
Octubre: 2.18
Noviembre: 1.90
Diciembre: 0.42
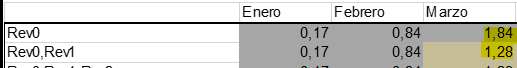
But the current output is the next:

In Mar, show 3.12 (sum of Rev0 and Rev1 for Mar)
Now, I need show without accumulation.
Attach a qlik with the problem.
Help me buddy's.
Thanks.
- Mark as New
- Bookmark
- Subscribe
- Mute
- Subscribe to RSS Feed
- Permalink
- Report Inappropriate Content
Hi,
If there is any field that allows you to filter only for 1.28 march value, you should put that in the set expression. This should get you the result as expected.
- Mark as New
- Bookmark
- Subscribe
- Mute
- Subscribe to RSS Feed
- Permalink
- Report Inappropriate Content
The attachment shows a technique to accomplish this. It works by first converting the Rev indicators into values with a numerical component, and by using these to order the values sequentially and picking the correct one using FirstSortedValue().
A solution is maybe impossible to create if we don't know how the values for Rev/Month combination are calculated. Therefore you may want to replace the expression in the Result table with something like
=FirstSortedValue(aggr(expr,...), -Rev)
where expr should be replaced with the original aggregation that calculates these values.
Best,
Peter