Unlock a world of possibilities! Login now and discover the exclusive benefits awaiting you.
- Qlik Community
- :
- All Forums
- :
- QlikView App Dev
- :
- Re: Sequential number instead of Dimension values
- Subscribe to RSS Feed
- Mark Topic as New
- Mark Topic as Read
- Float this Topic for Current User
- Bookmark
- Subscribe
- Mute
- Printer Friendly Page
- Mark as New
- Bookmark
- Subscribe
- Mute
- Subscribe to RSS Feed
- Permalink
- Report Inappropriate Content
Sequential number instead of Dimension values
Hi,
I am working on a line chart which has ID on X-axis and "no of days open" on Y-axis.

I am trying to name these IDs in numbers like this-
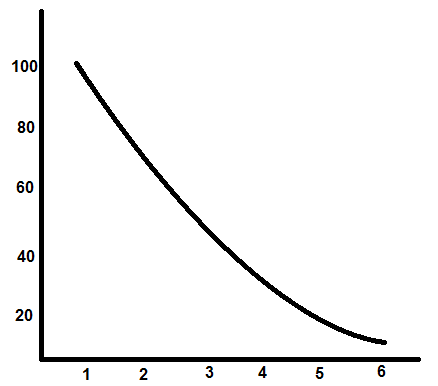
Any idea as to how to name these IDs in numbers?
- « Previous Replies
- Next Replies »
Accepted Solutions
- Mark as New
- Bookmark
- Subscribe
- Mute
- Subscribe to RSS Feed
- Permalink
- Report Inappropriate Content
This?
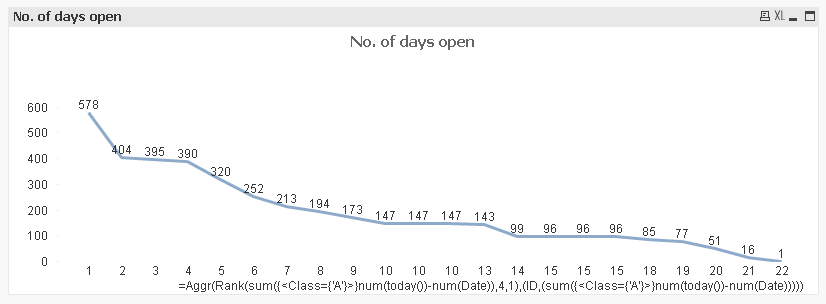
Exp (using sortable aggr()):
=Aggr(Rank(sum({<Class={'A'}>}num(today())-num(Date)),4,1),(ID,(sum({<Class={'A'}>}num(today())-num(Date)))))
- Mark as New
- Bookmark
- Subscribe
- Mute
- Subscribe to RSS Feed
- Permalink
- Report Inappropriate Content
Hi,
May be add a match table like the one below and use a new dimension [NewField]?
LOAD*Inline
[Field, NewField
10$, 1
44$, 2
$5, 3
$2, 4
$30, 5
$12, 6
];
- Mark as New
- Bookmark
- Subscribe
- Mute
- Subscribe to RSS Feed
- Permalink
- Report Inappropriate Content
May be using autonumber(), like:
Load
AutoNumber("no of days open") as Sequence
"no of days open",
...
And then use Sequence as dimension.
- Mark as New
- Bookmark
- Subscribe
- Mute
- Subscribe to RSS Feed
- Permalink
- Report Inappropriate Content
another option is to use Rank function to convert your dimension in number
=aggr(rank(ID),ID)
- Mark as New
- Bookmark
- Subscribe
- Mute
- Subscribe to RSS Feed
- Permalink
- Report Inappropriate Content
Hi Andrey,
Thank you for the response.
This is just an example showing 6 values, but in my database contains a huge list - Not practical this way.
- Mark as New
- Bookmark
- Subscribe
- Mute
- Subscribe to RSS Feed
- Permalink
- Report Inappropriate Content
- Mark as New
- Bookmark
- Subscribe
- Mute
- Subscribe to RSS Feed
- Permalink
- Report Inappropriate Content
Hi Rob,
Thank you for the response.
FieldIndex provides the load position of the value right?
I am looking for the ordering in the chart itself, whether the ID is at position 100 or 1000 in the load order doesn't matter. Only the position of that ID within the chart is to be displayed ( 1,2,3,4..... from left to right). Is this possible?
- Mark as New
- Bookmark
- Subscribe
- Mute
- Subscribe to RSS Feed
- Permalink
- Report Inappropriate Content
Hi Kushal,
Thank you for the response.
This only converts ID into a number, but doesn't display numbers starting from 1. Any other thought?
- Mark as New
- Bookmark
- Subscribe
- Mute
- Subscribe to RSS Feed
- Permalink
- Report Inappropriate Content
Hi Tresesco,
I am trying to avoid working with datamodel because "no of days open" is not just a field, it is an expression with several conditions on fields in more than 1 table. If I don't find a solution which can be implemented in the layout itself, I'll give this a try and will keep you posted.
Thank you.
- Mark as New
- Bookmark
- Subscribe
- Mute
- Subscribe to RSS Feed
- Permalink
- Report Inappropriate Content
please provide some sample data as well as the expression you are referring to.
thanks
regards
Marco
- « Previous Replies
- Next Replies »