Unlock a world of possibilities! Login now and discover the exclusive benefits awaiting you.
- Qlik Community
- :
- All Forums
- :
- QlikView App Dev
- :
- Set Analysis: Chart expression not including all d...
- Subscribe to RSS Feed
- Mark Topic as New
- Mark Topic as Read
- Float this Topic for Current User
- Bookmark
- Subscribe
- Mute
- Printer Friendly Page
- Mark as New
- Bookmark
- Subscribe
- Mute
- Subscribe to RSS Feed
- Permalink
- Report Inappropriate Content
Set Analysis: Chart expression not including all data set, why?
Hi,
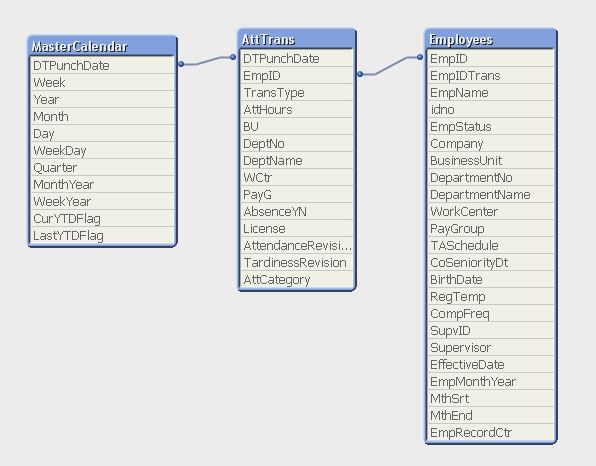
I want to count the whole headcount in table Employees. I have a record count field EmpRecordCtr. The expression in the linear chart is sum ({1} EmpRecordCtr) but it's not summing all employees in the table.
I think it's summing only those with corresponding transactions in table AttTrans, but I don't understand why since I'm including the set identifier {1} which is supposed to mean all records in the document. The dimensions in the chart are Mont / PayGroup respectively.
Any advise? See attached data model image.
- Mark as New
- Bookmark
- Subscribe
- Mute
- Subscribe to RSS Feed
- Permalink
- Report Inappropriate Content
Did you try sum ({1} TOTAL EmpRecordCtr) ? This expression ignores current selection and dimensions and pick the values in the entire application. I hope this helps.
- Mark as New
- Bookmark
- Subscribe
- Mute
- Subscribe to RSS Feed
- Permalink
- Report Inappropriate Content
Ok, good. Now I need to chart the total headcount per PayGroup (employee class). I've been trying but can't find the correct Set Analysis code for this. Can you help?
Thanks.
- Mark as New
- Bookmark
- Subscribe
- Mute
- Subscribe to RSS Feed
- Permalink
- Report Inappropriate Content
Make a chart with
Dimension:
PayGroup
Expression:
count(distinct EmpID) if you want the chart to filter by selections
OR
count({1} distinct EmpID) if you don't want the chart to filter by selections
- Mark as New
- Bookmark
- Subscribe
- Mute
- Subscribe to RSS Feed
- Permalink
- Report Inappropriate Content
The point is to get the absenteeism %, which the result of Hour Lost divided by Available Hours.
Available Hours is computed by multiplying headcount * 8 * working days (vAvailableDays). As you see, the headcount per PayGroup is part of the expression to get a %. The pursued % should be also shown per PayGroup per Month (these are dimensions in the chart).
Here's the expresion to compute absenteeism %:
sum
({<AttCategory-={'Null'}>}AttHours)/ (((sum({1} TOTAL EmpRecordCtr)*8)* $(vAvailableDays)
)-sum({<AttCategory={'Null'}>}AttHours))
What is wanted is to get the total headcount per PayGroup as part of the expression. Any help?