Unlock a world of possibilities! Login now and discover the exclusive benefits awaiting you.
- Qlik Community
- :
- All Forums
- :
- QlikView App Dev
- :
- Re: Set Analysis Error
- Subscribe to RSS Feed
- Mark Topic as New
- Mark Topic as Read
- Float this Topic for Current User
- Bookmark
- Subscribe
- Mute
- Printer Friendly Page
- Mark as New
- Bookmark
- Subscribe
- Mute
- Subscribe to RSS Feed
- Permalink
- Report Inappropriate Content
Set Analysis Error
Hi every one,
I have a table fields Month Year and Amount.
| Month Yr | Amount |
| Aug-15 | 250 |
| Sep-15 | 225 |
| 1-Oct | 450 |
| 1-Nov | 375 |
| Dec-15 | 275 |
| 1-Jan | 400 |
| Feb-16 | |
| Mar-16 | |
| Apr-16 | |
My requirements are :
| 1.Create a bar chart Month as Dimension and Sum(sales ) as Measures |
2.So if there is no sales value then last 3 months average should come for upcoming months with respectively. |
My Set Analysis Expression is =if(IsNull(month([Month Yr])),avg({<=(month([Month Yr]))={'Nov','Dec','Jan'}>}Amount),sum(Amount))
I have a Issue in this,Please any one help ?
- Mark as New
- Bookmark
- Subscribe
- Mute
- Subscribe to RSS Feed
- Permalink
- Report Inappropriate Content
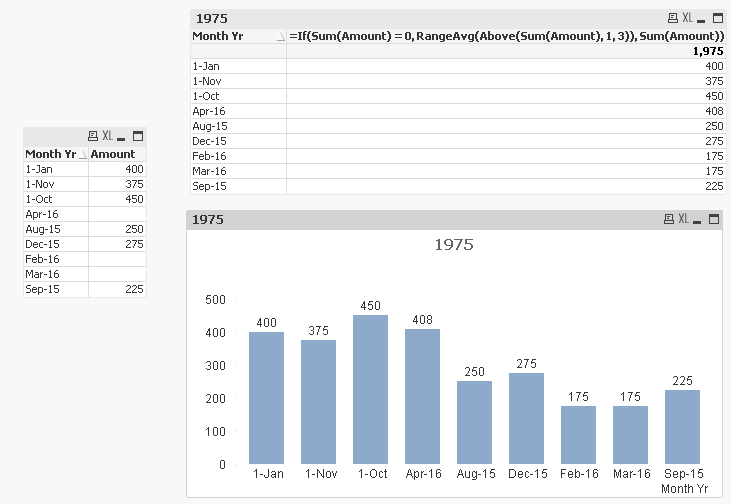
Not sure, but may be like this:
=If(Sum(Amount) = 0, RangeAvg(Above(Sum(Amount), 1, 3)), Sum(Amount))
- Mark as New
- Bookmark
- Subscribe
- Mute
- Subscribe to RSS Feed
- Permalink
- Report Inappropriate Content
Well, I think a first step in both approaches would be to create a proper Month Yr field with a numeric representation, that you can use as dimension with correct order or in set analysis field modifier 
- Mark as New
- Bookmark
- Subscribe
- Mute
- Subscribe to RSS Feed
- Permalink
- Report Inappropriate Content
Then, with your first approach, you could try something like
=if(Sum(Amount)=0 , avg({< YearMonth = {'Nov 15','Dec 15','Jan 16'}>} TOTAL Amount), sum(Amount))
- Mark as New
- Bookmark
- Subscribe
- Mute
- Subscribe to RSS Feed
- Permalink
- Report Inappropriate Content
Thank you for your Reply,
It was wrong when I gave your expression on Chart, In my Amount field last three values are null, What I want is average of previous three value should be on first null field of chart or table Likewise rest of two fields should be filled .
It is a sort of rolling Average
- Mark as New
- Bookmark
- Subscribe
- Mute
- Subscribe to RSS Feed
- Permalink
- Report Inappropriate Content
Thank you for you Instant reply
There is no error in Month Yr field
- Mark as New
- Bookmark
- Subscribe
- Mute
- Subscribe to RSS Feed
- Permalink
- Report Inappropriate Content
Not sure what you mean, can you share the expected output from the sample that you have shared with us?