Unlock a world of possibilities! Login now and discover the exclusive benefits awaiting you.
- Qlik Community
- :
- All Forums
- :
- QlikView App Dev
- :
- Set Analysis Filter Combination ?
- Subscribe to RSS Feed
- Mark Topic as New
- Mark Topic as Read
- Float this Topic for Current User
- Bookmark
- Subscribe
- Mute
- Printer Friendly Page
- Mark as New
- Bookmark
- Subscribe
- Mute
- Subscribe to RSS Feed
- Permalink
- Report Inappropriate Content
Set Analysis Filter Combination ?
Dear Expert,
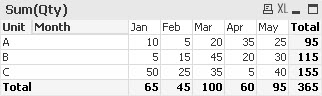
From the Pivot Table above, I want to filter the data in Unit = A and Month = Jan & Feb.
My expectation is the display should be like this
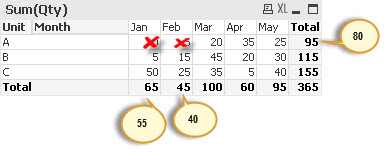
So, the Total of Jan should be 55, Feb should be 40, and Total of Unit A should be 80.
But, if I use set analysis like Sum({<Unit-={'A'}, Month-={'Jan','Feb'}>} Qty), the result becomes
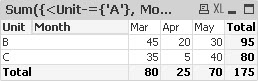
(Unit A, as well as Jan & Feb, are missing)
Please help me to find the solution for this case.
Thank you.
Accepted Solutions
- Mark as New
- Bookmark
- Subscribe
- Mute
- Subscribe to RSS Feed
- Permalink
- Report Inappropriate Content
Try this.
Sum({<Unit -= {"a"}>+<Month -={"Jan","Feb"}>}Value)
Regards,
Kaushik Solanki
- Mark as New
- Bookmark
- Subscribe
- Mute
- Subscribe to RSS Feed
- Permalink
- Report Inappropriate Content
Can you provide sample app here?
- Mark as New
- Bookmark
- Subscribe
- Mute
- Subscribe to RSS Feed
- Permalink
- Report Inappropriate Content
Try this.
Sum({<Unit -= {"a"}>+<Month -={"Jan","Feb"}>}Value)
Regards,
Kaushik Solanki
- Mark as New
- Bookmark
- Subscribe
- Mute
- Subscribe to RSS Feed
- Permalink
- Report Inappropriate Content
Yes. Herewith I attach the sample app.
Thank you.
- Mark as New
- Bookmark
- Subscribe
- Mute
- Subscribe to RSS Feed
- Permalink
- Report Inappropriate Content
Thank you Kaushik. It works 
- Mark as New
- Bookmark
- Subscribe
- Mute
- Subscribe to RSS Feed
- Permalink
- Report Inappropriate Content
Great.
Please mark a post which gave you the right answer as "Correct Answer"
Regards,
Kaushik Solanki
- Mark as New
- Bookmark
- Subscribe
- Mute
- Subscribe to RSS Feed
- Permalink
- Report Inappropriate Content
Great work Mr Kaushik.