Unlock a world of possibilities! Login now and discover the exclusive benefits awaiting you.
- Qlik Community
- :
- All Forums
- :
- QlikView App Dev
- :
- Re: Re: Set Analysis (How can i compare a Month in...
- Subscribe to RSS Feed
- Mark Topic as New
- Mark Topic as Read
- Float this Topic for Current User
- Bookmark
- Subscribe
- Mute
- Printer Friendly Page
- Mark as New
- Bookmark
- Subscribe
- Mute
- Subscribe to RSS Feed
- Permalink
- Report Inappropriate Content
Set Analysis (How can i compare a Month in 2014 with the same month in 2013, ex 2012, ex2011 etc)
Hi Community,
Im a slight NOOB when it comes to the Calendar.
How can i create chart that compares Each of the 12 Months in a Year, with the SAME months in all previous years?
It specifically pertains to comparing the count(Imported vehicles) of each month to the same month in other years?
Any pointers or help on where to start?
Regards,
Nico
- Mark as New
- Bookmark
- Subscribe
- Mute
- Subscribe to RSS Feed
- Permalink
- Report Inappropriate Content
Suposing you have "Month" and "Year" fields. In a graph that contains "Month" as dimmention, you could use the following expression:
Count({<Year={2014}>} Distinct Imported_ID )/Count({<Year={2013}>} Distinct Imported_ID )-1
If it doesn't work, you should send a reduced copy of the qvw to see your data.
- Mark as New
- Bookmark
- Subscribe
- Mute
- Subscribe to RSS Feed
- Permalink
- Report Inappropriate Content
Thanx for the response.
I have gotten as far as to use the month field and then i created SET analysis expression as follows:
=count({1<Year = {2014}>} IM5_RegisterationNumber_Extension)
It does works and gives me a "not-toooo-bad" chart, but it feels slightly disapointing, because if i want the other YEARS to be included, i now need to go make create them in the Expressions for each Year... it spands back to '05.. lol
See below!
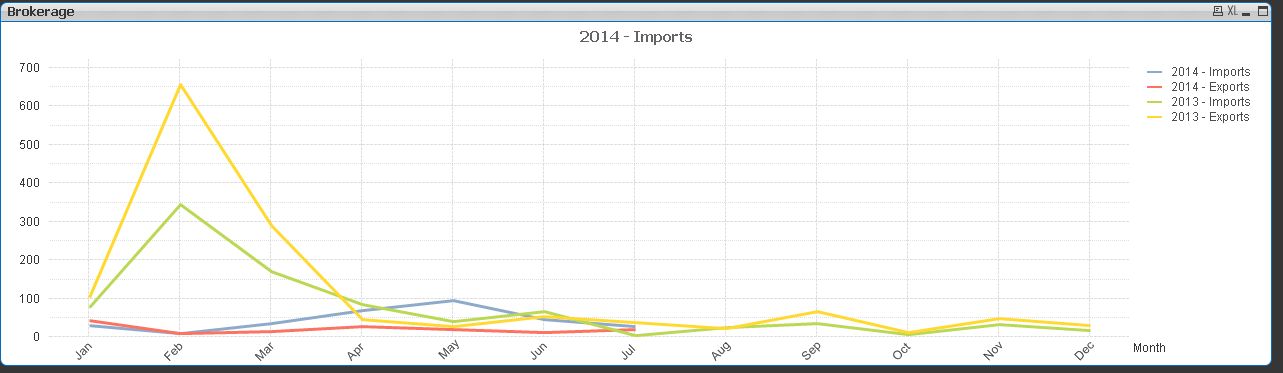
Please explain what is to be achieved with the code you provided? Why do you (divide) 2014 by 2013's count?
- Mark as New
- Bookmark
- Subscribe
- Mute
- Subscribe to RSS Feed
- Permalink
- Report Inappropriate Content
HI there,
I dont think you need set-analysis here as your dimensions are month and year. Please take a look at the example. I am not sure where you are facing a problem (may be I might be missing something here)
- Mark as New
- Bookmark
- Subscribe
- Mute
- Subscribe to RSS Feed
- Permalink
- Report Inappropriate Content
I have supossed you need to show the "Growth" between these years.
I can't uderstand what you really need. Please, specify by another way.
- Mark as New
- Bookmark
- Subscribe
- Mute
- Subscribe to RSS Feed
- Permalink
- Report Inappropriate Content
Let me rephrase.
I want to achieve this:
| Year | Jan | Feb | Mar | Apr | etc |
| 2010 | Total Count for Jan, in 2010 | ||||
| 2011 | Total Count for Jan, in 2011 | ||||
| 2012 | Total Count for Jan, in 2012 | ||||
| 2013 | Total Count for Jan, in 2013 | ||||
| 2014 | Total Count for Jan, in 2014 |
In a chart format.
Sorry for the confusion lads.
- Mark as New
- Bookmark
- Subscribe
- Mute
- Subscribe to RSS Feed
- Permalink
- Report Inappropriate Content
I think Ajay example is what you need... Or not?