Unlock a world of possibilities! Login now and discover the exclusive benefits awaiting you.
- Qlik Community
- :
- All Forums
- :
- QlikView App Dev
- :
- Set Analysis Intersection help
- Subscribe to RSS Feed
- Mark Topic as New
- Mark Topic as Read
- Float this Topic for Current User
- Bookmark
- Subscribe
- Mute
- Printer Friendly Page
- Mark as New
- Bookmark
- Subscribe
- Mute
- Subscribe to RSS Feed
- Permalink
- Report Inappropriate Content
Set Analysis Intersection help
Hello All -
I have a situation where we have two payroll systems that an employee might be paid from. It's considered an exception if the employee is paid out of both systems during the same week. The payroll team has asked for a trending chart of the number of exceptions per week. The data has a flag (1 or 2) that indicates which system paid.
Basically, what I want to do is to count employees that have both flags in a week. The dimension is WeekStart and the expression is (I've tried with and with out quotes around the numbers):
Count({<Payroll.RSFlag = {1}> * <Payroll.RSFlag = {2}>} Distinct Employee)
Shouldn't this give me a count of employees with both flags, but not one or the other? My chart gives me 0.
Thanks in advance,
mike
Accepted Solutions
- Mark as New
- Bookmark
- Subscribe
- Mute
- Subscribe to RSS Feed
- Permalink
- Report Inappropriate Content
I haven't tested.. but if it is not working, you can try below option...
SUM(IF(Aggr(Count(DISTINCT Payroll.RSFlag),Employee,Call.WeekStartMon)>1,1))
- Mark as New
- Bookmark
- Subscribe
- Mute
- Subscribe to RSS Feed
- Permalink
- Report Inappropriate Content
Hi, Mike!
Could you try expression below?
Sergey.
count(aggr(if(min(Payroll.RSFlag)<>max(Payroll.RSFlag),Employee),Call.WeekStartMon))

- Mark as New
- Bookmark
- Subscribe
- Mute
- Subscribe to RSS Feed
- Permalink
- Report Inappropriate Content
SUM(Aggr(COUNT({<Payroll.RSFlag = {1}, Employee = P({<Payroll.RSFlag= {2}>}Employee)>}DISTINCT Employee),Employee))
- Mark as New
- Bookmark
- Subscribe
- Mute
- Subscribe to RSS Feed
- Permalink
- Report Inappropriate Content
Hello, Manish!
I have checked your expression with my test example.
It looks like there is a mistake...
Could you check?
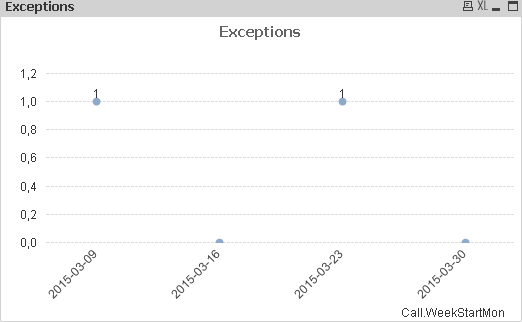
t1:
LOAD * Inline [
Employee, Call.WeekStartMon, Payroll.RSFlag
ADALEE, 2015-03-09, 1
ADALEE, 2015-03-09, 2
ADALEE, 2015-03-16, 1
ADALEE, 2015-03-23, 1
BBBAAA, 2015-03-23, 2
BBBAAA, 2015-03-30, 1
BBBAAA, 2015-03-30, 2
];

2015-03-23 - your expression shows 1, meanwhile the right answer is 0 because there are different employees in this week. not the same.
Sergey
- Mark as New
- Bookmark
- Subscribe
- Mute
- Subscribe to RSS Feed
- Permalink
- Report Inappropriate Content
I haven't tested.. but if it is not working, you can try below option...
SUM(IF(Aggr(Count(DISTINCT Payroll.RSFlag),Employee,Call.WeekStartMon)>1,1))
- Mark as New
- Bookmark
- Subscribe
- Mute
- Subscribe to RSS Feed
- Permalink
- Report Inappropriate Content
Hi Sergey,
Unfortunately, this returned 0, but I'm going to keep trying to tweak it.
Thanks!
- Mark as New
- Bookmark
- Subscribe
- Mute
- Subscribe to RSS Feed
- Permalink
- Report Inappropriate Content
Thanks, Manish! This looks like it works.
mike
- Mark as New
- Bookmark
- Subscribe
- Mute
- Subscribe to RSS Feed
- Permalink
- Report Inappropriate Content
Hi Manish -
So, this works for one week, but if I take off the date filter, the line chart explodes and shows 20x the correct number. An example is the week of 2/2 gives me 42, but if I unfilter the date, that same week shows 465.
I vaguely remember something about indirect set analysis and that the p/e part is calculated at the chart level, not the row level so the calculation is based on any that are both 1 and 2, not just during the week dimension. Do you know if that's true?
mike
- Mark as New
- Bookmark
- Subscribe
- Mute
- Subscribe to RSS Feed
- Permalink
- Report Inappropriate Content
Mike, can you attach your model with some example data?
- Mark as New
- Bookmark
- Subscribe
- Mute
- Subscribe to RSS Feed
- Permalink
- Report Inappropriate Content
Hi Sergey -
I actually got it to work by cheating a little. Instead of a line chart, I used a bar chart with expressions for 8 weeks. (We have a field for relative weeks built into the master calendar so it will roll) Then uses Manish's formula.
Thank you for your help!
mike